|
Waterfall Chart Settings
Waterfall Charts are a form of cumulative Bar Chart, showing the cumulative effect across a series of changes.
They can aid in the understanding of how performance changes contribute to a final position.
Color can be used to represent either a Stage in the process, or the change in performance for that stage.
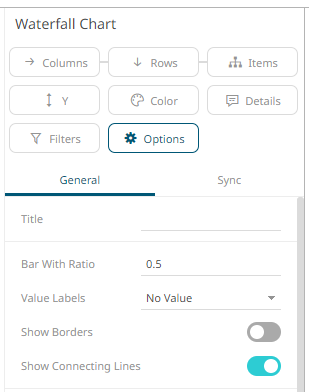
The waterfall
chart settings pane is displayed after clicking the Options  button.
|
Setting |
Description |
|
Bar Width Ratio (%) |
Defines the ratio of the width within the bars. Default is .5. |
|
Value Labels |
Defines what type of value labels are shown in bars: Bar Value or Cumulative Value. |
|
Show Borders |
Determines whether borders are drawn around bars. |
|
Show Connecting Lines |
Determines whether connecting lines are drawn between bars. |
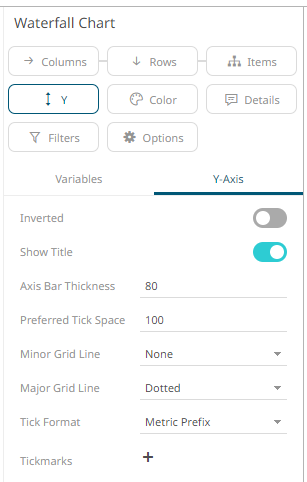
Other visualization-specific properties can be set by clicking on the Y-Axis variable drop area and then selecting the Y-Axis tab: