


|
OHLC Graph Settings
OHLC Graphs also display time-based distributions of price data. For each time slice, they display:
q Opening Price
q Highest Price
q Lowest Price
q Closing Price
Similar with the Candle Stick Graph, a vertical line defines the range of traded prices across the period. However, in this case, the left notch determines the opening price and the right notch determines the closing price.
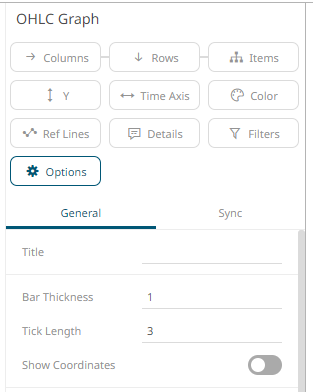
The OHLC graph
settings pane is displayed after clicking the Options  button.
|
Setting |
Description |
|
Bar Thickness |
Specifies the width in pixels of the OHLC Body. |
|
Tick Length |
Specifies the length in pixels of the Open and Close ticks. |
|
Show Coordinates |
Determines whether the graph coordinates (i.e., X-Y plots, or Date/Time-Y plots) on mouse over are displayed in the visualization. |
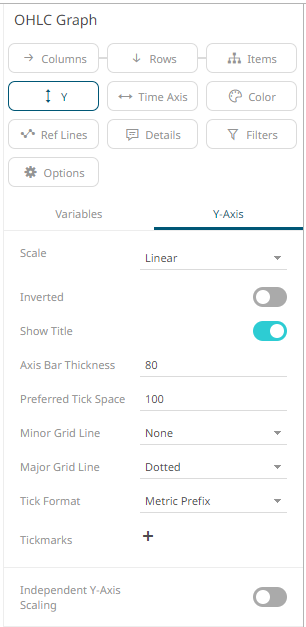
Other visualization-specific properties can be set by clicking on the Y-Axis variable drop area and then selecting the Y-Axis tab:
|
Setting |
Description |
|
Independent Y-Axis Scaling |
Determines whether to have each visualization Y-axis in a cross tab automatically scaled independent of the others. |