


|
Adding a Time Filter Box
Time-series visualizations can be filtered to show a specified time window, through the Time Filter box. Only one can be added per dashboard.
Steps:
1. After double-clicking or drawing a rectangle
on the dashboard canvas, click  on the Select Part pane
then click the Time Filter Box
on the Select Part pane
then click the Time Filter Box  icon.
icon.
The Time Filter Box Settings pane is displayed, and the Time Filter Box part is added on the dashboard canvas.
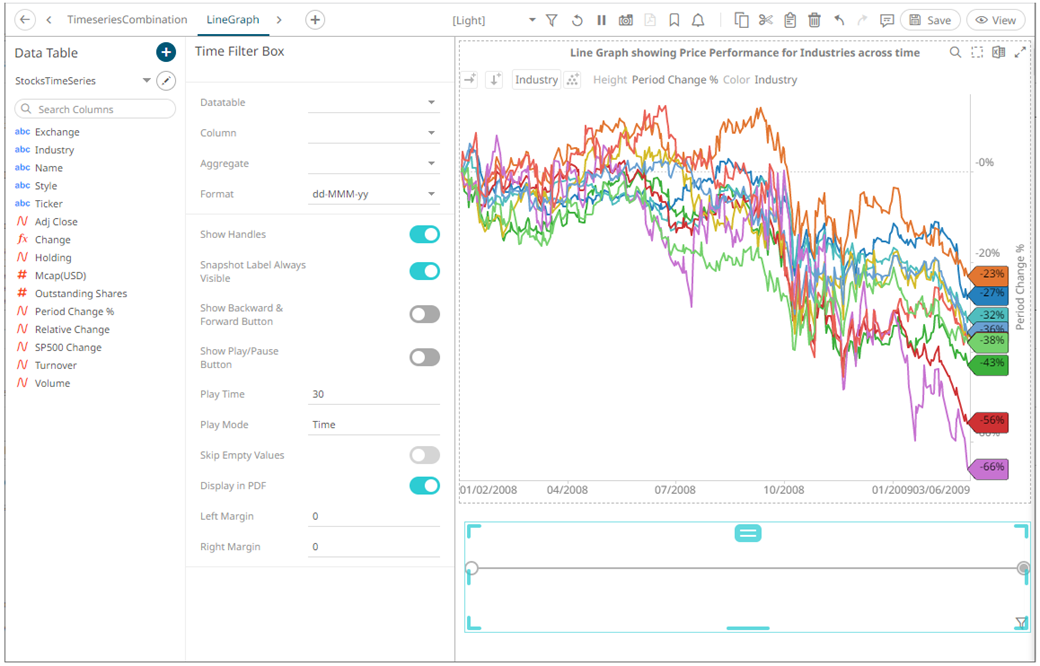
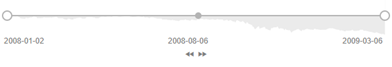
2. Select a Data Table from the drop-down list then select the time series filter Column.
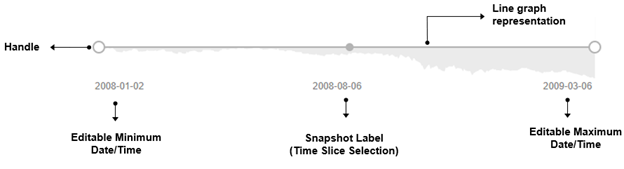
The Time Filter Box now displays:
· Editable Minimum Date/Time
· Editable Maximum Date/Time
· Handles for quick filtering of the time period
· Time Slice Selection (Snapshot Time)
· Line Graph representation of the time series column
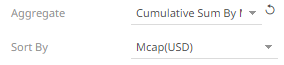
3. Select the Aggregate type.
· If you set the aggregation method to Cumulative Sum or Cumulative Sum by Max, the Sort By drop-down list is enabled and displays a list of numeric data columns in the selected data table that can be used as the sorting column for the aggregate.
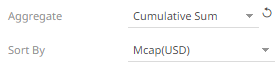
Cumulative Sum By Max is, in practice, Cumulative Sum with a setting to use Max as the sort by aggregation.
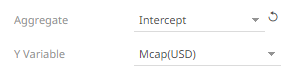
· If you set the aggregation method to Intercept or Slope, the Y Variable drop-down list is enabled and displays a list of numeric data columns in the selected data table that can be used as the Y-axis variable column for the aggregate.
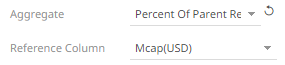
· If you set the aggregation method to Percent of Parent Reference, Percent of Total Reference, or Ratio of Sums, the Reference Column drop-down list is enabled and displays a list of numeric data columns in the selected data table that can be used as the reference column for the aggregate.
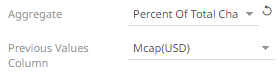
· If you set the aggregation method to Percent of Total Change, the Previous Values Column drop-down list is enabled and displays a list of numeric data columns in the selected data table that can be used as the previous column for the aggregate.
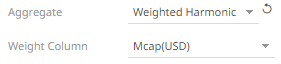
· If you set the aggregation method to Weighted Harmonic Mean, Weighted Mean, Weighted Population Variance, Weighted Stdev, Weighted Stdevp, Weighted Sum, or Weighted Variance, the Weight Column drop-down list is enabled and displays a list of numeric data columns in the selected data table that can be used as the weight column for the aggregate.
4. The Format field lets you specify the format that Date/Time will be displayed in.
5. Proceed to setting the time filter box settings:
|
Setting |
Description |
|
Show Handles |
Determines whether handles are displayed. Enabled by default. |
|
Snapshot Label Always Visible |
Determines whether to always display the snapshot label. Enabled by default. |
|
Show Backward & Forward Button |
Determines whether the Backward and Forward buttons are displayed to move through time slices.
|
|
Show Play/Pause Button |
Determines whether the Play It subsequently automatically moves through each time slice until it reaches the end of the time window, causing the playback to reset. |
|
Play Time |
How long the play time will run if the Pay Mode is Ticks. Default is 30. |
|
Play Mode |
Determines whether the play mode is either Time or Ticks Setting to Time will playback the time slices as quickly as possible Setting to Ticks will playback a time slice based on the set Play Time For example, there are 8 time slices in the Time Series visualization, setting the Play Time to 16 will playback a time slice per 2 seconds (i.e., will move the snapshot one step per 2 seconds). |
|
Skip Empty Values |
Determines whether to skip empty values. |
|
Display in PDF |
Determines whether to include the time filter box in the PDF output. |
|
Left Margin |
The margin area on the left side of the time filter box. |
|
Right Margin |
The margin area on the right side of the time filter box. |
 or
Pause
or
Pause  button is displayed
and adds the ability to automatically play through all the
time slices.
button is displayed
and adds the ability to automatically play through all the
time slices.
6. Click the Save  icon on the toolbar to save the
changes.
icon on the toolbar to save the
changes.
When
saved, the  notification
is displayed.
notification
is displayed.