Pivoting
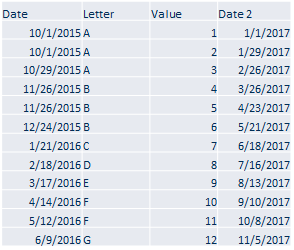
Pivoting in Panopticon is always with respect to time. Panopticon finds the first date or Date/Time column from left to right in the dataset and uses that. As an example, in the table below, if you want the Date 2 column to be the one used, transform the data so it will be the first date column in the dataset.

Pivoting in Panopticon is about taking the row values in category and turning them into columns by some operation like:
q Count
q Last
q Min
q Max
q None
q Sum (default)
Mean or median are not used since it is about real time response in Panopticon, and these functions are expensive to calculate. For static data, if you need to pre-calculate those types of transformations, you can use a table visual to determine the value. However, for real-time data and real-time response, the functions Count, Last, Min, Max, and Sum are exactly what you need.
Multiple pivot columns can be defined.
Either different:
q Measure Columns
q Value Columns
q Aggregates
When this occurs, the resulting pivoted column names will be prepended as appropriate to ensure that each column is uniquely identified.
|
NOTE |
In cases where some columns cannot be aggregated after pivoting, it is recommended to select the None aggregate. For more information, refer to Example 4.
|


