|
Example 2
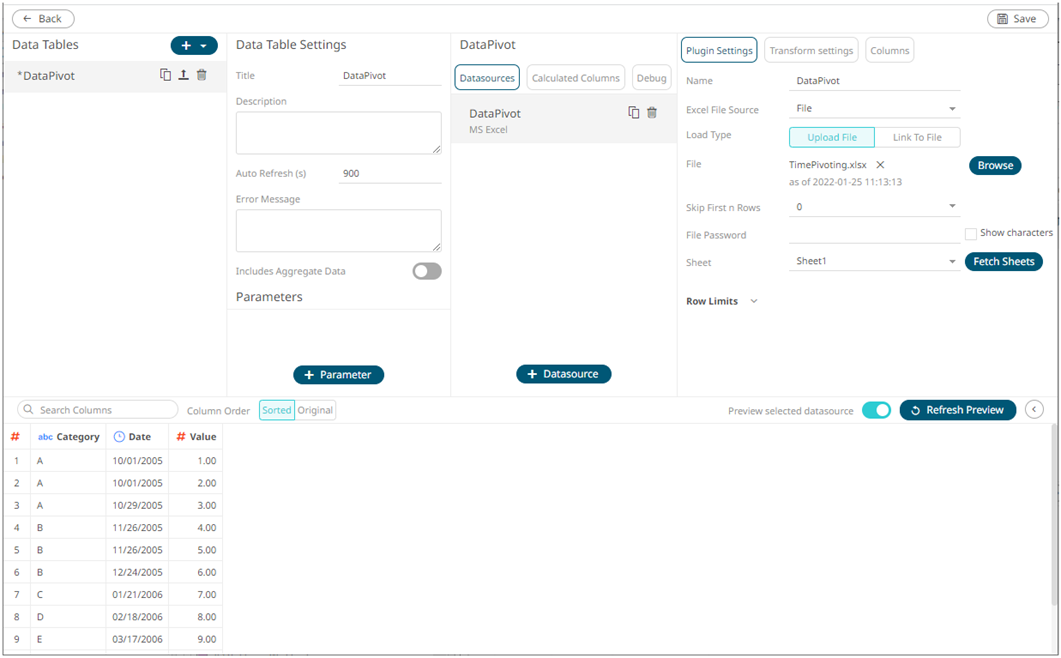
For the sample above, the Measure column is the one you want to pivot. In this case, you will need to pivot to create a unique Sum per date and measure.
The column named Category will be used as the Measure (pivot) column, and value column (Value) is the one you will aggregate.
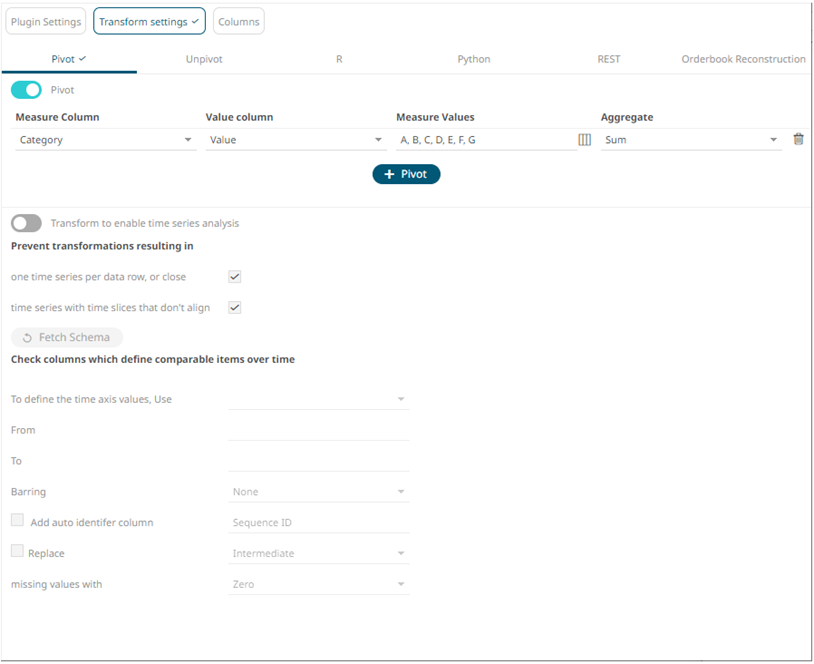
Click
the Populate Measure Values
 button to populate the Measure
Values box that you can aggregate (i.e., A, B, C, D, E, F,
G). The default Sum aggregation
is applied.
button to populate the Measure
Values box that you can aggregate (i.e., A, B, C, D, E, F,
G). The default Sum aggregation
is applied.
Clicking  transforms the data and is displayed on the Data Sources
Preview.
transforms the data and is displayed on the Data Sources
Preview.
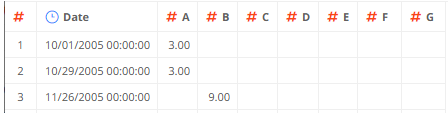
The expected pivot is achieved as there is only one row per unique date, and the Letter and values columns are summed up.
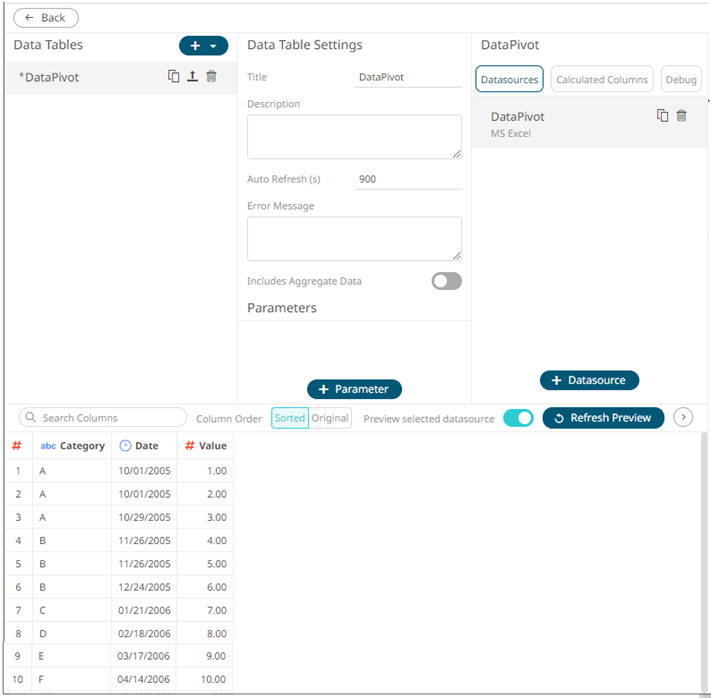
The original dataset had 12 rows, now it is reduced to 10 because the original dataset had the following rows:
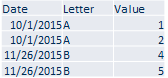
And they have been pivoted by Sum to the values in the first and third rows.