


|
3D Scatter Plot Settings
3D Scatter Plots are a 3D perspective version of the 2D Scatter Plot. They provide a clearer understanding of physical shapes in a 3D space. The Scatter Plot 3D is made up of a series of points where each point has X Position, Y Position and Z Position.
In addition, items can be sized by numeric data values, and colored by numeric or text data values. Items can also be shown as different shapes – either standard shapes available in Panopticon or custom shapes that you add to a custom shape palette.
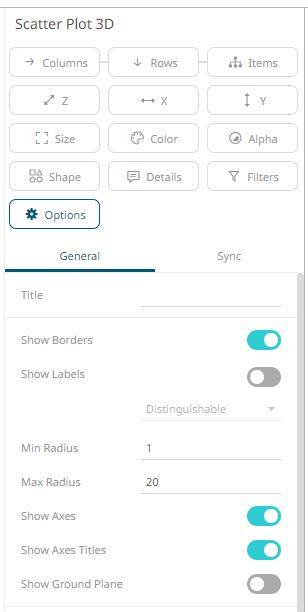
The 3D Scatter
Plot settings pane is displayed after clicking the Options  button.
|
Setting |
Description |
|
Show Borders |
Determines whether borders are visible around each scatter point. |
|
Show Labels |
Determines whether labels will be displayed. If enabled, select how scatter point labels are shown: · Distinguishable · All |
|
Min Radius |
The minimum radius in pixels of the scatter point. |
|
Max Radius |
The maximum radius in pixels of the scatter point. |
|
Show Axes |
Determines whether axes are displayed. |
|
Show Axes Titles |
Determines whether axes titles are displayed. |
|
Show Ground Plane |
Determines whether the ground plane is displayed. |