


|
Associating Columns to the Variables
You can associate columns of data from the data table in the Design Toolbox with the variables available for the visualizations in your dashboard.
|
NOTE |
You must be in the Open Workbook in Design Mode to add variables to visualizations.
|
Steps:
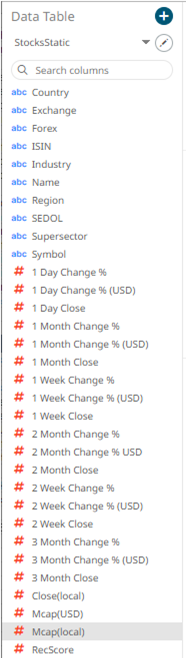
1. In the Data Table pane, select the column you want to associate with a variable.
In this example, we are selecting the Mcap(local) data column.
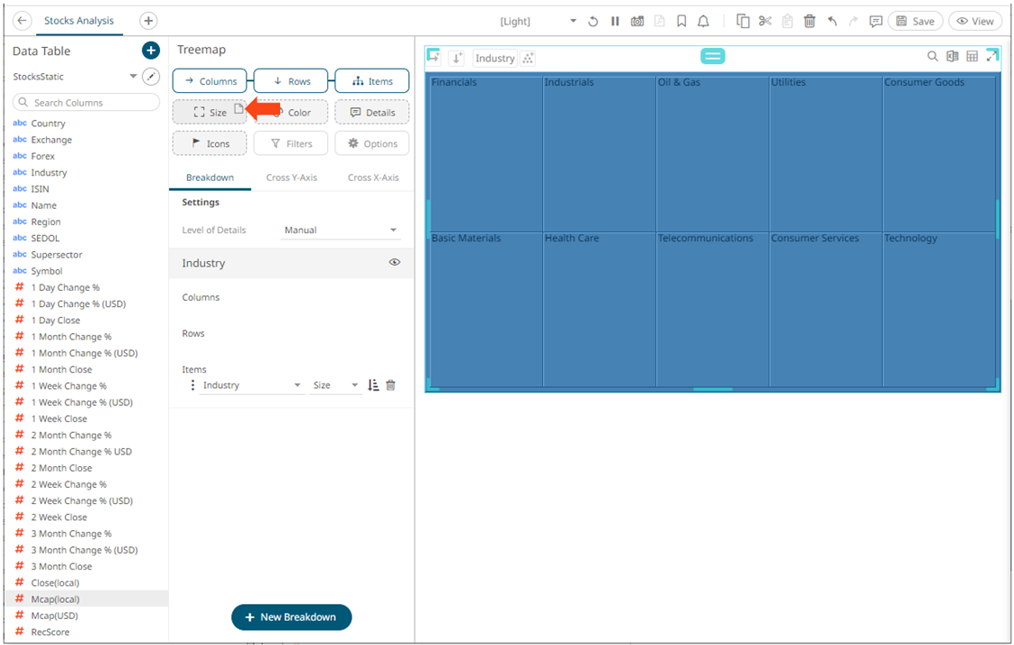
2. Drag the column to the variable you want to use.
In this example, we are dragging and dropping the Mcap(local) data column to the Size variable drop area in a Treemap, with the Industry column added as the breakdown.
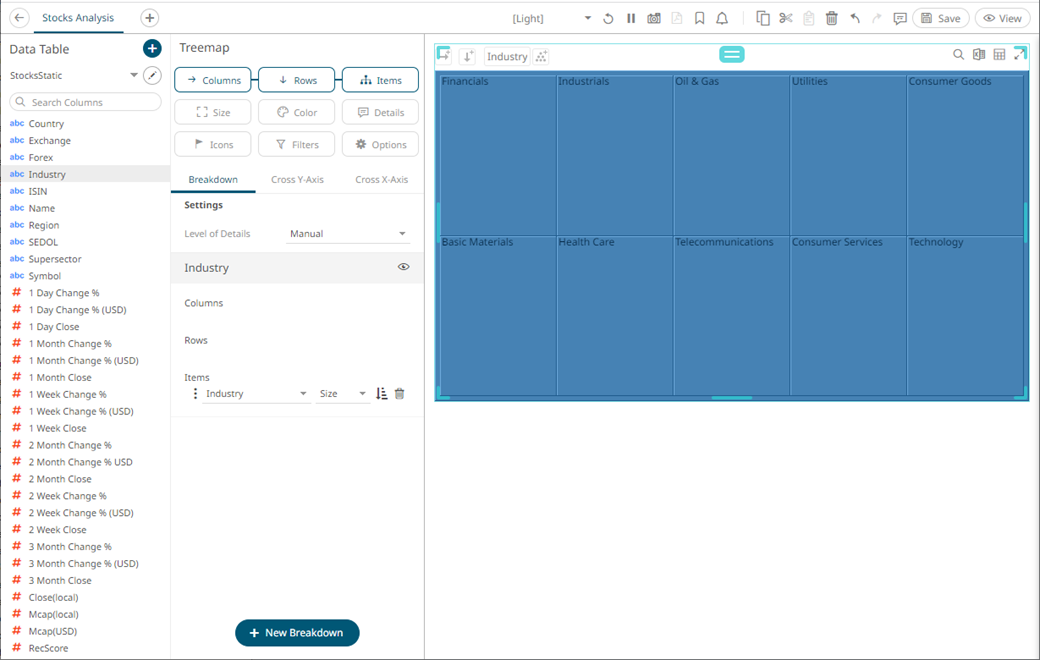
Note that the default of the Size variable is [Empty] which displays the Industry values in a uniform size.
3. Drop the column to the Size variable drop area.
The column is displayed under the Size variable list and on the Size variable on the visualization. The Treemap also changes to reflect the values of the Mcap(local) column as the Size variable.
Note that the [Empty] state is now disabled.
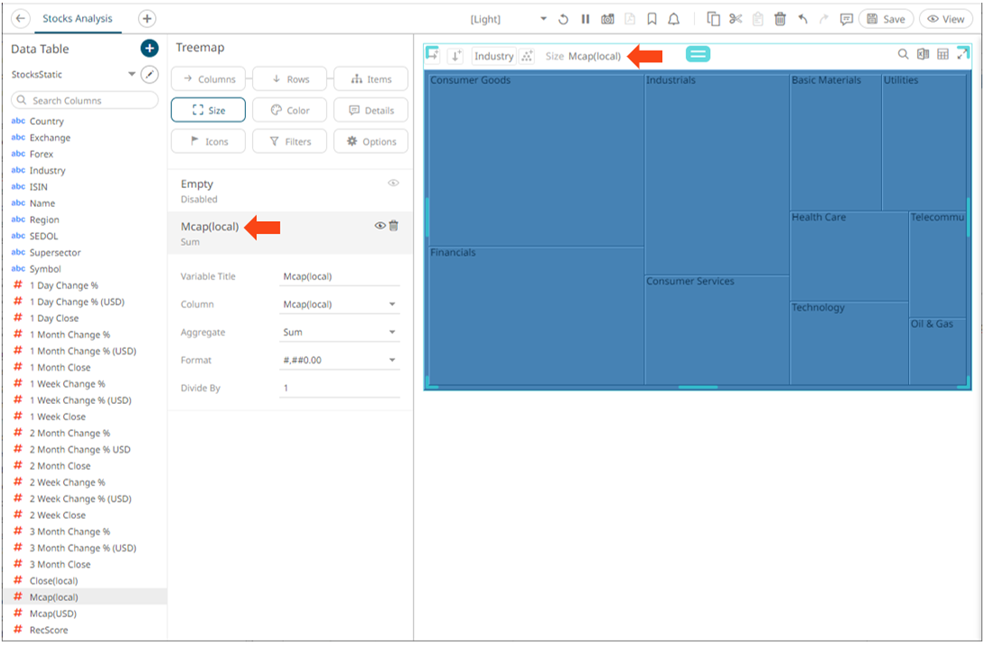
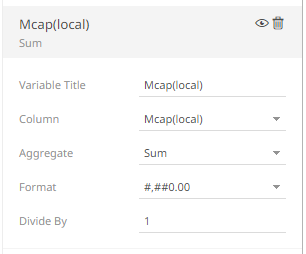
By default, the name of the variable is the dragged column and the aggregate is Sum.
4. You can drag more data columns onto the same variable. This produces a list of options that the user can select from.
In our example, we have added the RecScore data column to the same Size variable for the Treemap.
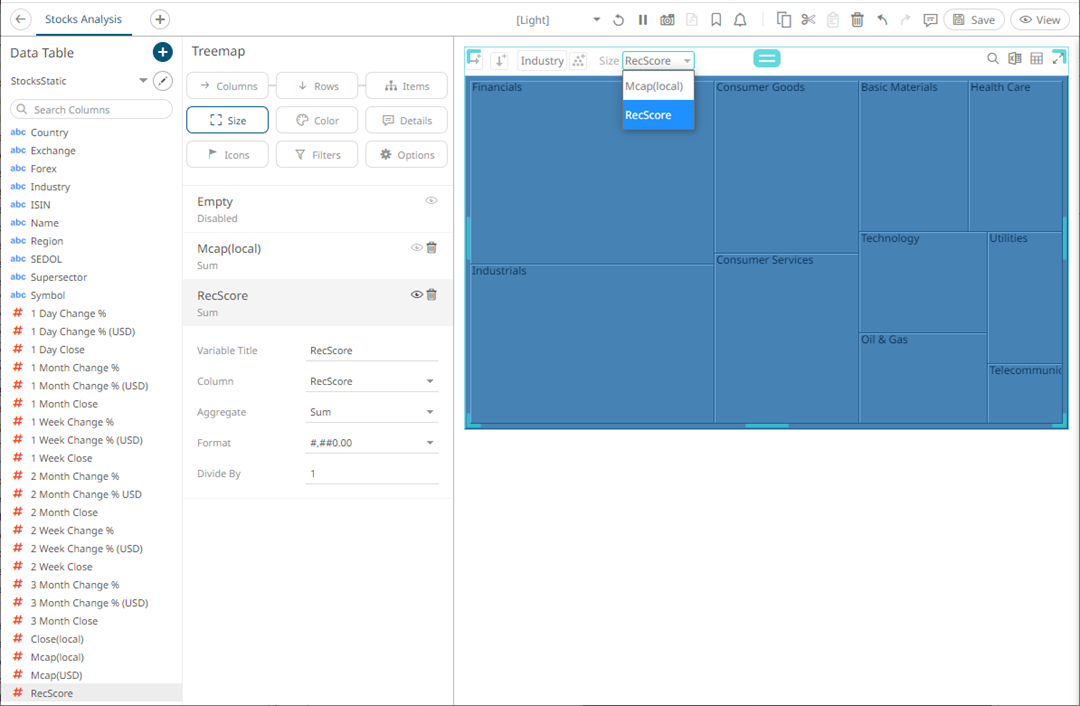
The user will be able to quickly select between two different views of the data. In one view, the Treemap will associate Size with Mcap (local) and with RecScore in the second view.