|
Guidelines in Using the Numeric Combination Graph
Sample data used in this section.
|
sample |
var_x |
var_y |
|
s1 |
0 |
1 |
|
s1 |
1 |
2 |
|
s1 |
2 |
1 |
|
s1 |
3 |
2 |
|
s1 |
4 |
1 |
|
s2 |
0 |
3 |
|
s2 |
1 |
4 |
|
s2 |
3 |
4 |
|
s2 |
4 |
3 |
|
s3 |
0 |
5 |
|
s3 |
1 |
6 |
|
s3 |
2 |
5 |
|
s3 |
3 |
6 |
|
s3 |
4 |
5 |
When you want to visualize several samples, or series, as lines of the same numeric variable in the Numeric Combination Graph, there is a requirement that you do the following:
q Create a Numeric Bucket column of type "Id" (unique values), based on the X-variable column
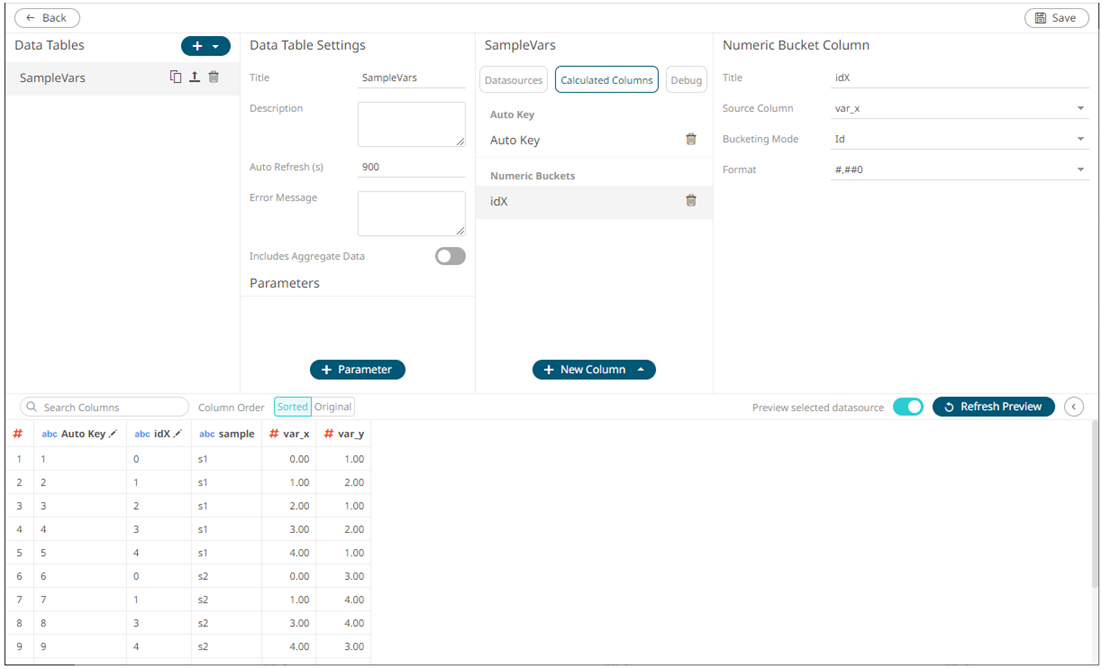
q Include the X-variable Id Numeric Bucket in the Items on the visualization
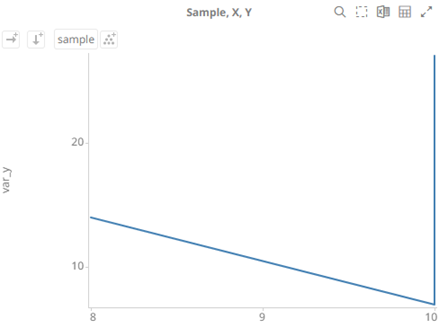
Sample 1. Only the sample column is added on the Items list
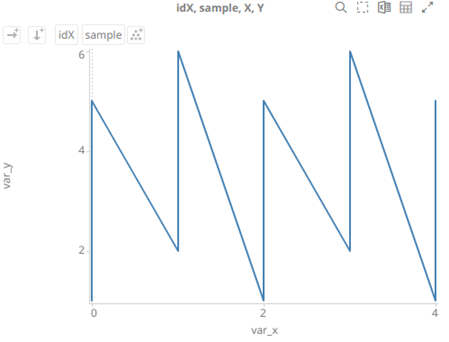
Sample 2. sample and idX columns are added on the Items list.
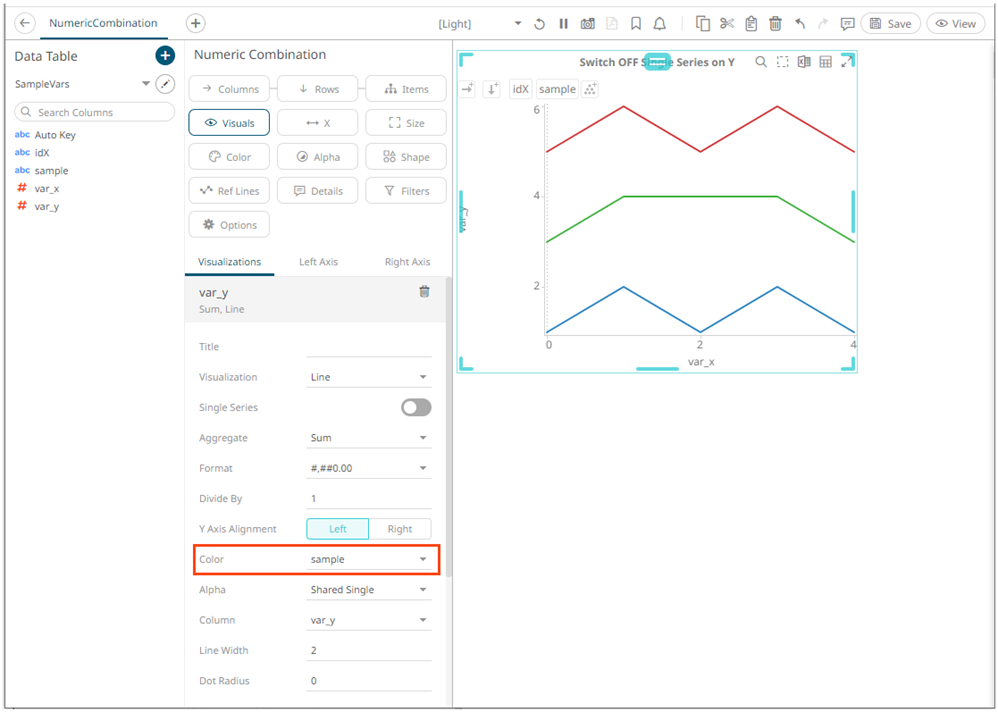
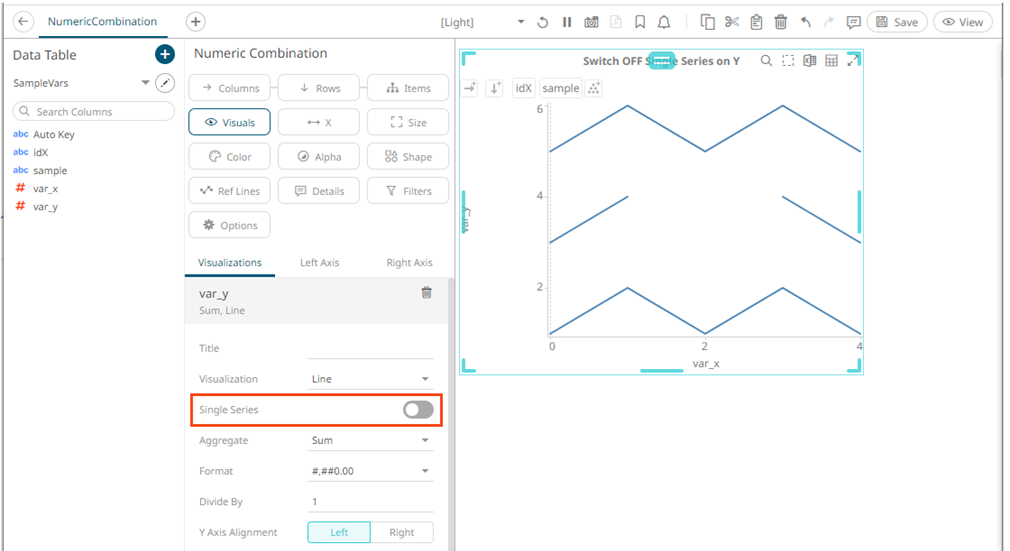
q Switch off Single Series for the Y-axis variable
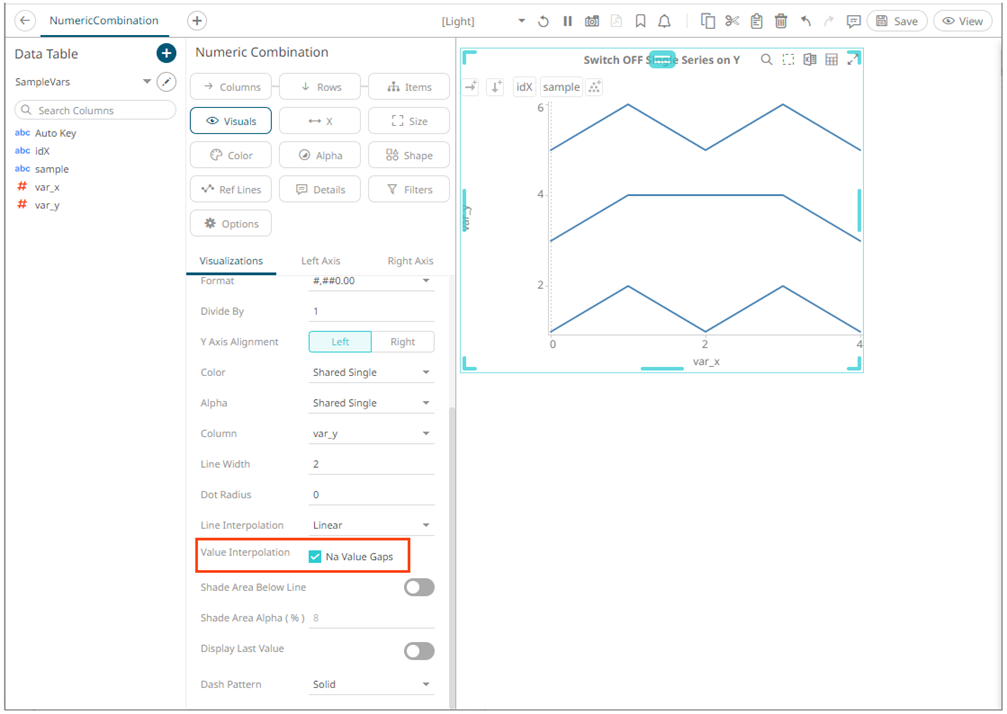
With the above settings in place, you will get separate lines per each sample identity. You will then also be able to color those line by the sample identity. If your dataset has missing values, for one or several of the samples/series, you can bridge those value gaps by switching on interpolation of NA value gaps on the Y-variable.
Sample 3. Single series on Y is turned OFF
Sample 4. Interpolation of NA value gaps on Y is turned ON.
Sample 5. Color line by the sample column