


|
Setting the Numeric Axis Range
|
NOTE |
· Users with an Administrator, Designer, or Viewer role can set the numeric axis range. · Setting the numeric axis range can also be done on the X or Y variable pane. For example, in the Candle Stick Graph visualization:
|
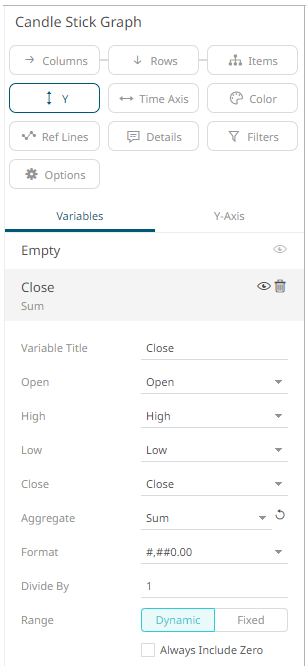
For most of the visualizations with numeric axis, you can set the visible range for the Y and/or Y variable which can either be calculated dynamically (the default, enabled Dynamic).
Right-click on a Y or X axis and select Select Axis Range in the context menu.
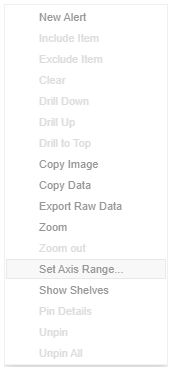
The Range dialog displays.
|
NOTE |
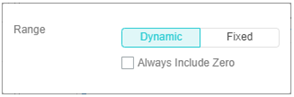
Some of the visualizations have the Always Include Zero box. Check to let the axis scale start at zero, and grow to any number that may show up in the data.
|
Or set between predefined limits by clicking Fixed. This displays the Min and Max text boxes that are populated with the default values taken from the data set.
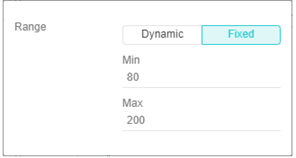
You can opt to enter new Min and Max values.