


|
Context Menu
The visualizations in a workbook provide the following right-click menu options:
|
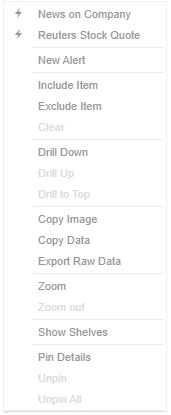
Visualization Context Menu |
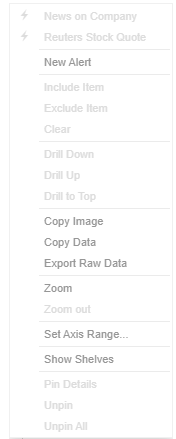
Visualization Context Menu of the Numeric Axis |
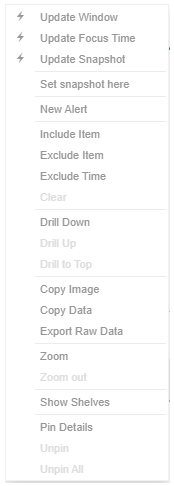
Time Series Visualization Context Menu of the Time Axis |
|
|
|
|
|
|
|
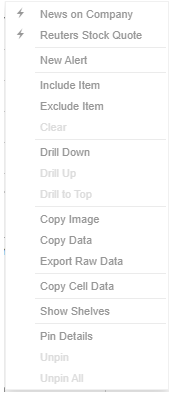
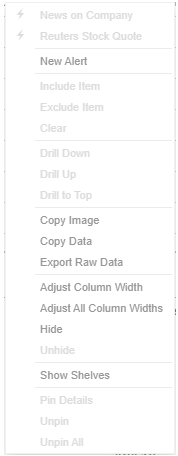
Table visualization context menus depending on where you click on the visualization
|
||
|
Context Menu |
Description |
|
Run an automatic parameterization. |
|
|
Run a workbook action on the visualization. |
|
|
New Alert |
Create an alert. |
|
Allows visualization filtering. Options include: · Filter Include · Filter Exclude · Filter Clear |
|
|
Allows drilling into visualizations. Options include: · Drill Down · Drill Up · Drill to Top |
|
|
Allows exporting of data. Options include: · Copy Image · Copy Data · Export Raw Data · Copy Cell Data |
|
|
Allows zooming in and out of visualization sections. |
|
|
Allows cross tab, breakdown, and variable shelves to be displayed. |
|
|
Allows pinning of the Details pop-up. Options include: · Pin Details · Unpin · Unpin All |
The additional time series visualization context menu options include:
|
Setting |
Description |
|
Available in the time series visualization context menu when the Snapshot Grid Line is rendered or set to Dotted, Dashed, or Solid in the Time Axis variable. |
|
|
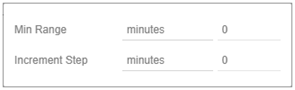
Set Axis Range |
Allows setting of the time axis range:
· Min Range The minimum time axis range. Supported units are milliseconds, seconds, minutes, hours, days, months, quarters, and years. · Increment Step Controls how much the time axis span is extended at the point when the latest value is at the end of the current time axis span. Supported units are milliseconds, seconds, minutes, hours, days, months, quarters, and years. This setting helps in seeing how a real-time data set grows from left to right along the time axis, giving a better impression and understanding of the progress. |
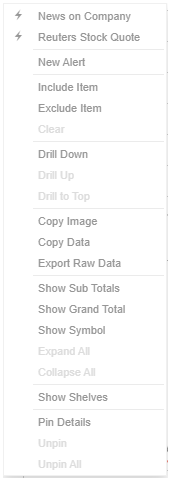
The additional Table visualization context menu options include:
|
Setting |
Description |
|
Adjust column width in the table visualization. |
|
|
Hide or display columns in the table visualization. |
|
|
Display the hierarchy column. |
|
|
Expand or collapse sections of the hierarchy. |
|
|
Show Grand Total |
Determines whether the Grand Total aggregate row is shown in the table. |
|
Show Sub Totals |
Determines whether Sub Total aggregate rows are shown in the table. |
|
Show <Column> |
Display the breakdown column. |