


|
Visualization Filtering
Visualizations themselves can be used as filters by selecting items, and right-clicking to display the context menu with these three options:
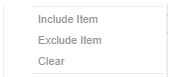
q Include Item filters the dashboard to include the selected items.
q Exclude Item filters the dashboard to exclude the selected items.
q Clear removes any visualization filters.
|
NOTE |
In the Web client, the Include Item and Exclude Item options are disabled when there is no breakdown or the root is selected in visualizations.
|
For time series visualizations, an additional option is available.
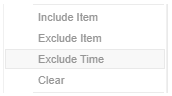
Exclude Time filters all the series to exclude the time point/s.
When a visualization
filter is applied, filter icons appear at the left of the filter column
title  and on the
  toolbar of the dashboard. Clicking
  or
or  will remove the filter.
Also, the
Show Active Filters  icon displays on the toolbar. This allows
viewing of all the active filters
on the dashboard and its visualizations.
icon displays on the toolbar. This allows
viewing of all the active filters
on the dashboard and its visualizations.