


|
Bullet Graph
Bullet Graphs were designed by Stephen Few to remove unnecessary clutter and instead focus on visualizing metrics like Key Performance Indicators (KPI).
Research has shown that Bullet Graphs are easier to interpret in less time than the radial gauges or speedometers often seen in BI dashboards.
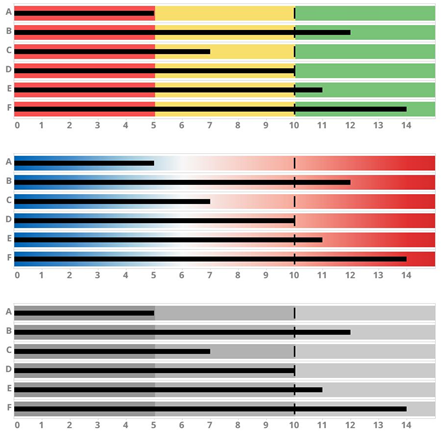
Figure 3-7. A horizontal bullet graph.