


|
Map Plot
Use Map Plots to display geographic data, where you have longitudes and latitudes associated with individual data points. These plots clearly show data correlations and clustering that is geographic in nature.
In a Map Plot, the visualization expects Latitude and Longitude measures to be associated. It will then retrieve from the selected map tile provider the appropriate background map to display under the data points. This background map is constructed by retrieving individual map tiles at set zoom levels.
As the background map is provided automatically, it relies on:
q A range of supplied longitudes & latitudes to provide a bounding area
q An active Internet connection to retrieve the map tile images
Panopticon ships with a number of cross reference datasets to determine the appropriate latitude/longitude for datasets. These have been provided through subsets of the data available at GeoNames.org. ( http://www.geonames.org )
More detailed geo-coding data is available from this website, and many others.
Zooming into the map will cause, new map tiles to be retrieved, and a new background map image behind the data points to be displayed.
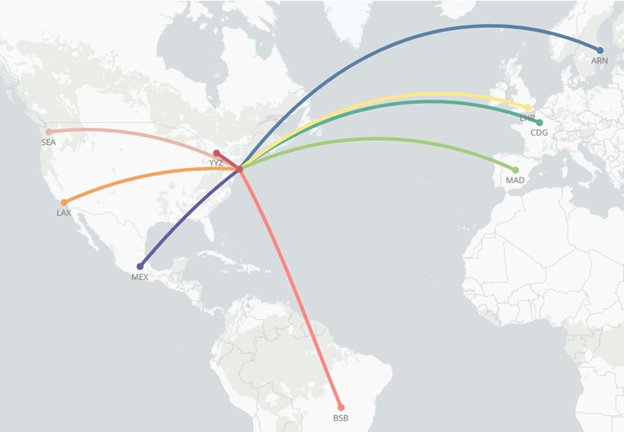
Figure 3-31. Map Plot of the flights of an airline.
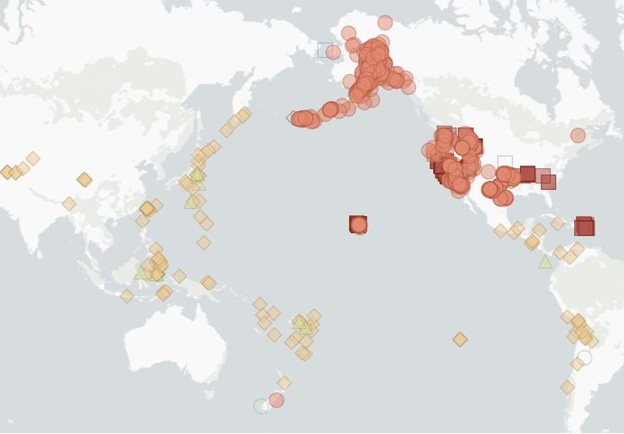
Figure 3-32. Map Plot with different shapes.
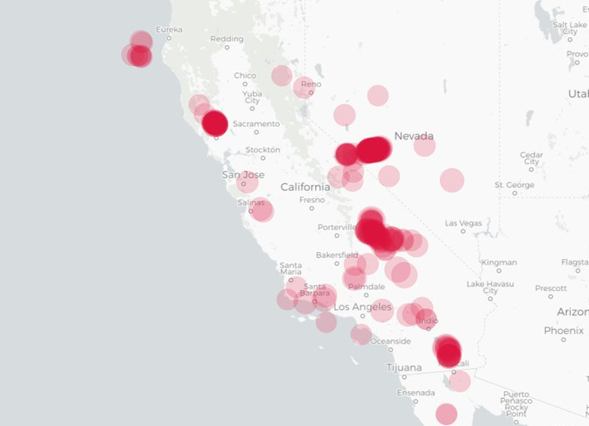
Figure 3-33. Map Plot with Alpha blending when there are many overlapping shapes.
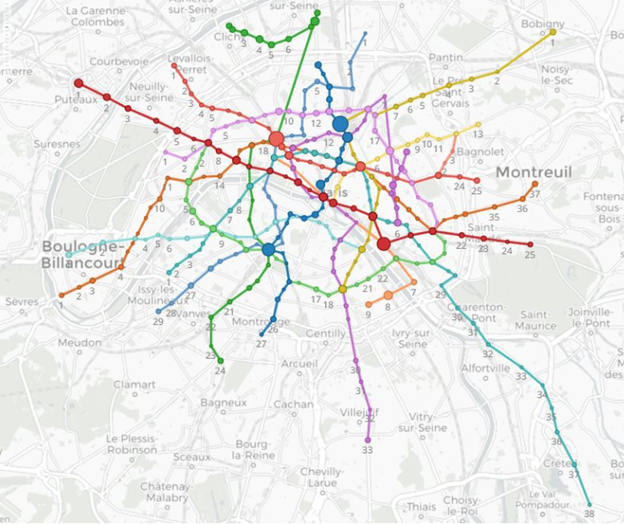
Figure 3-34. Map Plot with path lines between shapes.