


|
Surface Plot
Surface Plots are used to identify trends and outliers within numeric surfaces.
The Surface is made up of a series of points where each point has:
q X Position
q Y Position
q Color (which represents the Z axis).
The Surface Plot can support data sets where the X and Y positions can both be regular and irregular in their distribution.
Additionally, the color scale can be continuous or stepped to show a surface gradient.
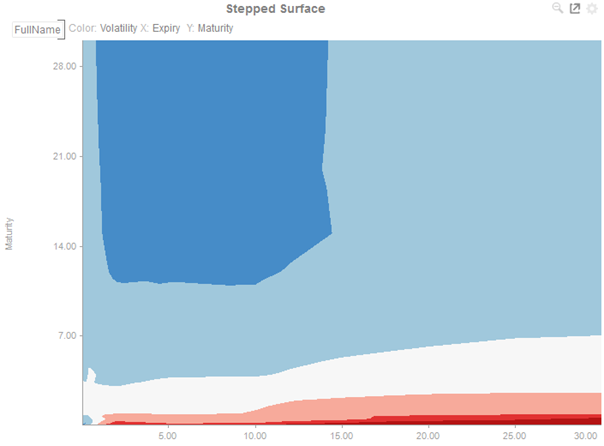
Figure 3-55. A surface plot with stepped colors.
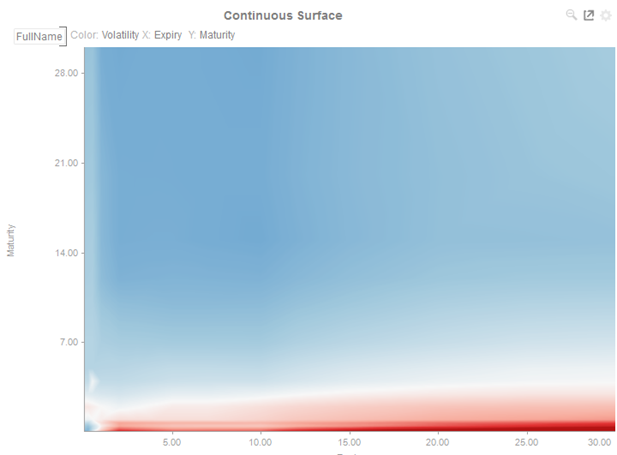
Figure
3-56. A surface plot with continuous colors.