


|
Table
A table can be used to display a small dataset where all the values are visible or the aggregate values of a larger data set.
The table can be configured to show hierarchies, allowing sub totals and grand totals to be displayed. Additionally, branches of the hierarchy can be expanded and collapsed.
The table can be sorted by clicking on a column heading, and sorting is applied across the defined hierarchy.
Columns widths can be adjusted manually or automatically, and columns can be hidden when required.
Columns cells can be represented in their value form or, alternatively, graphically as a series of micro-charts including:
q Bullet Graph
q Bar Graph
q Dot Plot
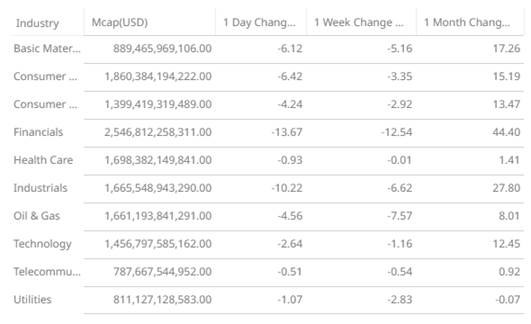
Figure 3-61. A simple table.
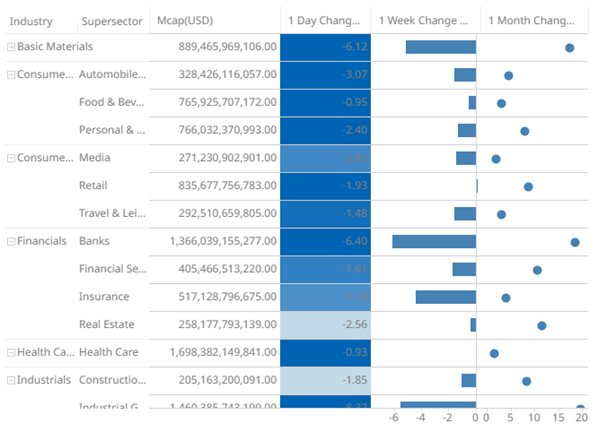
Figure 3-62. A table with hierarchy, totals, and micro-charts.