imagesc
Display a matrix as an image with scaled colors.
Syntax
h = imagesc(z)
h = imagesc(x, y, z)
h = imagesc(..., [cmin cmax])
Inputs
- z
- Matrix specifying the data for the matrix to be displayed.
- x
- Optional vector to specify the minimum (first element of the vector) and maximum (last element of the vector) values of the x-axis. These values may be used to move or scale the image on the x-axis.
- y
- Optional vector to specify the minimum (first element of the vector) and maximum (last element of the vector) values of the y-axis. These values may be used to move or scale the image on the y-axis.
- cmin, cmax
- Range of the colormap.
Outputs
- h
- Handle of the imagesc graphics object.
Examples
Simple imagesc example:
cla;
z = [1 2 3; 4 5 6; 7 8 9];
imagesc(z)
colorbar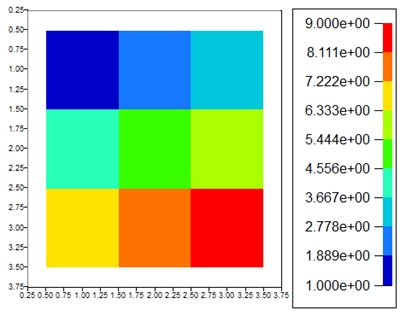 Figure 1. Imagesc simple example
Define the range of the colormap:
cla;
z = [1 2 3; 4 5 6; 7 8 9];
imagesc(z, [3 7]);
colorbar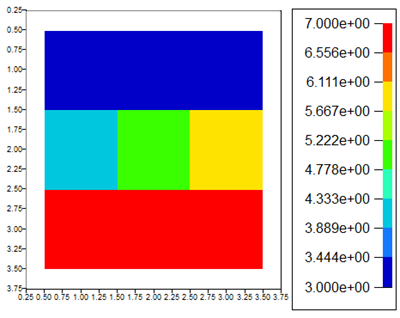 Figure 2. Colormap range set.
imagesc with x and y matrices
example:
cla;
im1 = imagesc(rand(10,10));
hold on;
im2 = imagesc(11:20, 11:20, rand(10,10));
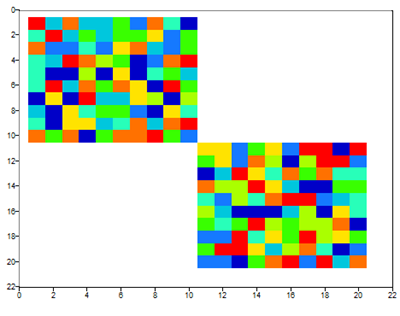 Figure 3. Image repositioned on x and y axis.
x and y may be used to scale an image:
cla;
im1 = imagesc(rand(10,10));
hold on;
im2 = imagesc(11:15, 11:15, rand(10,10));
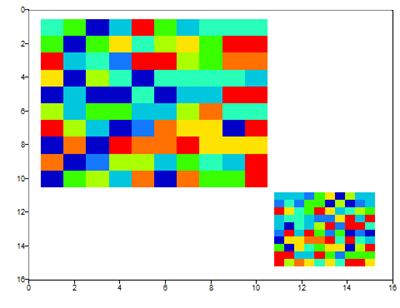 Figure 4. Scaled and repositioned image.
Comments
If there are no axes, they will be created first. If x and y are omitted, the index of the z columns is used for the x coordinates and the index of the z rows is used for the y coordinates.