rlocus
rlocus diagram.
Syntax
rlocus(sys)
[rldata, k] = rlocus(sys, increment, k_max, k_min)
Inputs
- sys
- A linear time-invariant transfer function or state space system.
- increment
- The interval between consecutive gain values.
- k_max
- The maximum gain value.
- k_min
- The minimum gain value.
Outputs
- rldata
- The plotted closed-loop poles. Each column contains the poles for a gain value, and each row traces a branch of the locus.
- k
- The gain values.
Example
Create the rlocus diagram of the given transfer function.
s = tf('s');
        GH = (s^2 + 2*s + 2) / (s * (s^4 + 9*s^3 + 33*s^2 + 51*s + 26));
        rlocus(GH);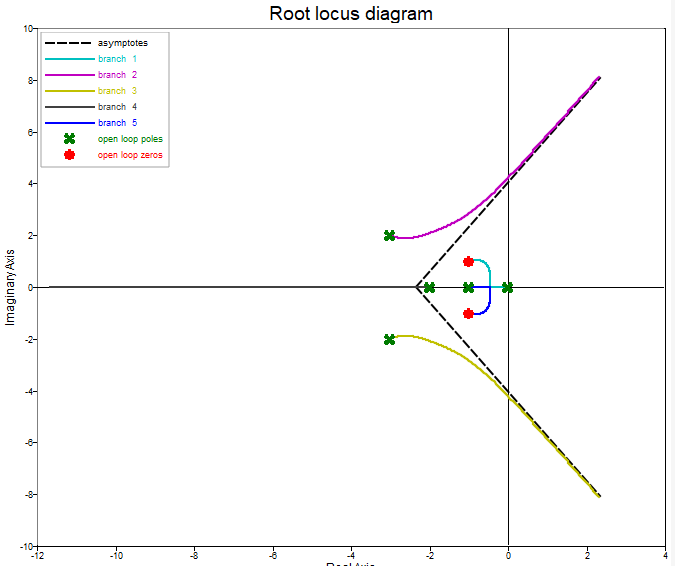
Figure 1. rlocus figure 1
Comments
If the output arguments are omitted, the function plots the results.