text
Creates a textbox at coordinate x,y with text 't'.
Syntax
h = text(x, y, t)
h = text(x, y, z, t)
h = text(..., property, value, ...)
Inputs
- x, y, z
- x, y, and z coordinates for the textbox. z is valid only in 3D plots.
- t
- Text to be added in the axes.
- property
- Properties that control the appearance or behavior of the graphics object.
- value
- Value of the properties.
Outputs
- h
- Handle of the text graphics object.
Examples
clf
text(1,1,'hello world')
Figure 1. Simple text example
clf;
scatter(1, 1);
t = text(1,1,'hello world', 'horizontalalignment','center', 'verticalalignment', 'top');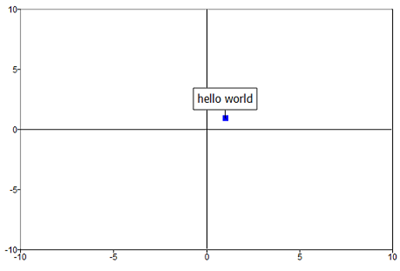 Figure 2. Text with horizontal and vertical alignment properties set
clf;
plot([4 6 2 8], '-o');
% Both boxes can be moved by mouse click and drag
% The attached text box is connected to the point by a line
t = text(2, 6,'Text box attached to (2,6)');
t = text(3, 5,'Free text box','attached','off');
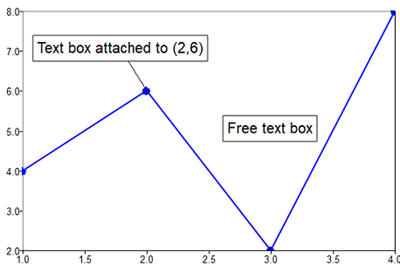 Figure 3. Attached property example
clf;
x=[0:0.2:2*pi];
y=x;
z=sin(x')*cos(y);
s=surf(x, y, z);
t = text(10,90,'hello world');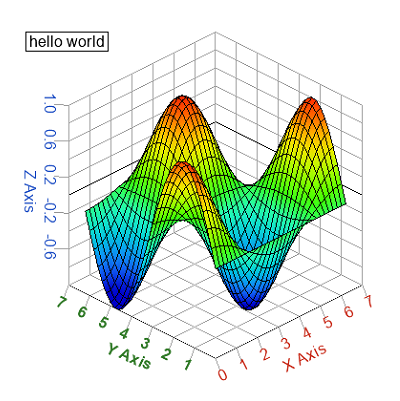 Figure 4. Text in 3D plot
clf;
x=[0:0.2:2*pi];
y=x;
z=sin(x')*cos(y);
s=surf(x, y, z);
t = text(3.2,4.6,1,'Point 1');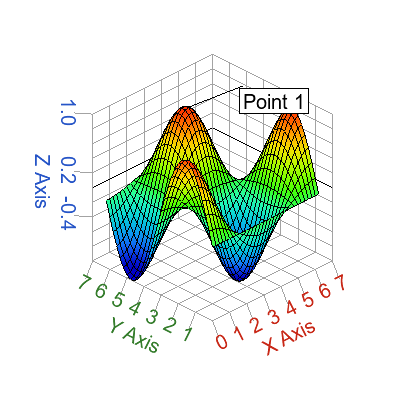
Figure 5. Text on 3D point
clf;
X = [25 50 75 100 125 180];
bar(10:15, X);
text(1:length(X), X, strsplit(num2str(X)), 'horizontalalignment', 'center', 'verticalalignment', 'top');
text(2.5, 150, 'Point (2.5, 150)')

figure;
bar(10:15, X);
set(gca, 'barorientation', 'horizontal');
text(X, 1:length(X), strsplit(num2str(X)), 'horizontalalignment', 'left', 'verticalalignment', 'middle');
text(150, 2.5,'Point (150, 2.5)')
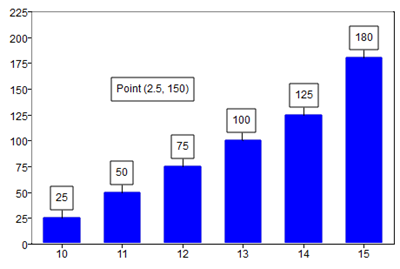 Figure 6. Text on vertical bar plot
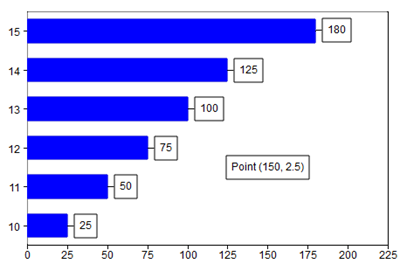 Figure 7. Text on horizontal bar plot
clf;
x = [0:0.1:2*pi];
plot(x, cos(x));
% 2 lines using '\n'
text(1,0.4,'Line 1\nLine 2');
% 2 lines using cell input
text(5,0.4,{'Line 1', 'Line 2'});
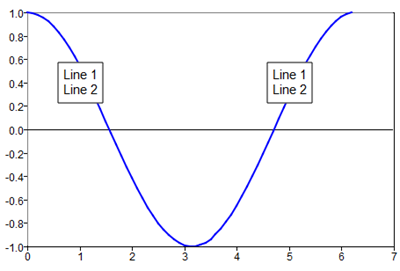
Figure 8. Multi-line text
clf;
x = [0:0.1:2*pi];
plot(x, cos(x));
text([1 3 5],[0.6 0.4 0.2],{{'Text 1', 'Line 2'}, {'Text 2','Line 2'}, {'Text 3','Line 2'}});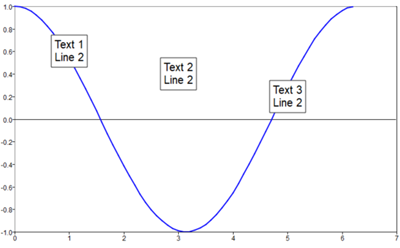
Figure 9. Add many text boxes with multi-line text
clf;
a = 2;
b = 4;
x = -10:0.1:10;
y1 = a*x+b;
y2 = a*x.^2+b;
y3 = a.*sqrt(abs(x))+b;
plot(x,[y1;y2;y3])
axis([-10 10 -1 20])
legend({'y1','y2','y3'});

text(-8, 18, {'a = 2', 'b = 4'})
text(6, 14,'$y1=ax+b$','interpreter','tex','color','b');
text(-2, 17,'$y2=ax^2+b$','interpreter','tex','color',[0,123,0]);
text(-8, 10,'$y3=a\sqrt{\left|x\right|}+b$','interpreter','tex','color','r');
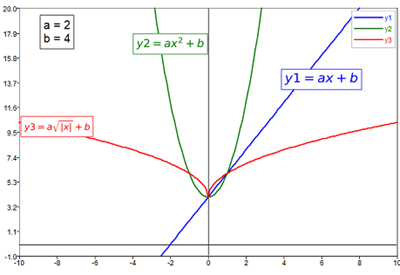
Figure 10. Use 'tex' interpreter
Comments
In 3D plots, if the z value is not provided, then the x and y coordinates are window coordinates (a percentage of the window width and height). The reference point is the bottom left corner of the window.