fftshift
Shift frequency spectrum related vectors to center the dc element
Syntax
y = fftshift(x)
y = fftshift(x,dim)
Inputs
- x
- The frequency spectrum related vectors to shift.
- dim
- The dimension on which to operate.
Outputs
- y
- The shifted vectors.
Example
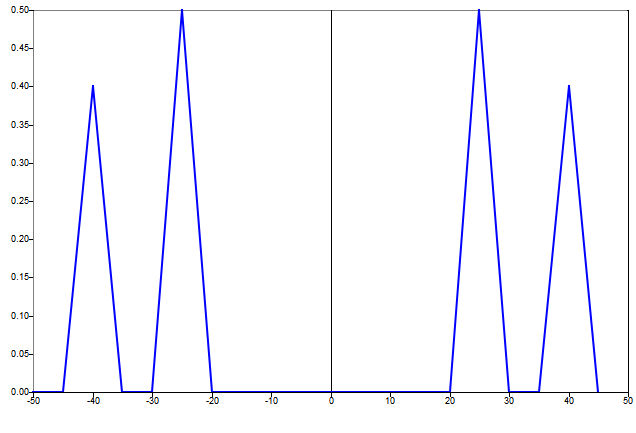
fft of signal with two frequency components.
f1 = 25;                 % first frequency component
f2 = 40;                 % second frequency component
fs = 100;                % sampling frequency
ts = 1/fs;               % sampling time interval
n = 20;	                 % number of samples
t = [0:ts:(n-1)*ts];  % time vector
signal = sin(2*pi*f1*t) + 0.8 * sin(2*pi*f2*t);
ft = fft(signal) / n;    % normalized fft
fq = freq(n,fs,'shift'); % frequency vector
plot(fq, fftshift(abs(ft)));
Figure 1. fft figure 1
The frequency spacing is 5 Hz, so both components fall exactly on one of the frequency vector values.
Comments
After fftshift, if a vector has an even number of samples, the Nyquist frequency of the input will become the first element of the output vector, where it is viewed as a negative frequency.