Contour/Transient Animation
Use Flow Simulator's Contour and Transient Animation options to see the results of your model analysis on the Flow model as colored contours, or as a time animation for transient analysis. Use this tool to visualize common model inputs like restriction diameter or length, and to quickly check model inputs.
From the menu bar, select PostProcessing > Contour / Transient Animation to use the options.
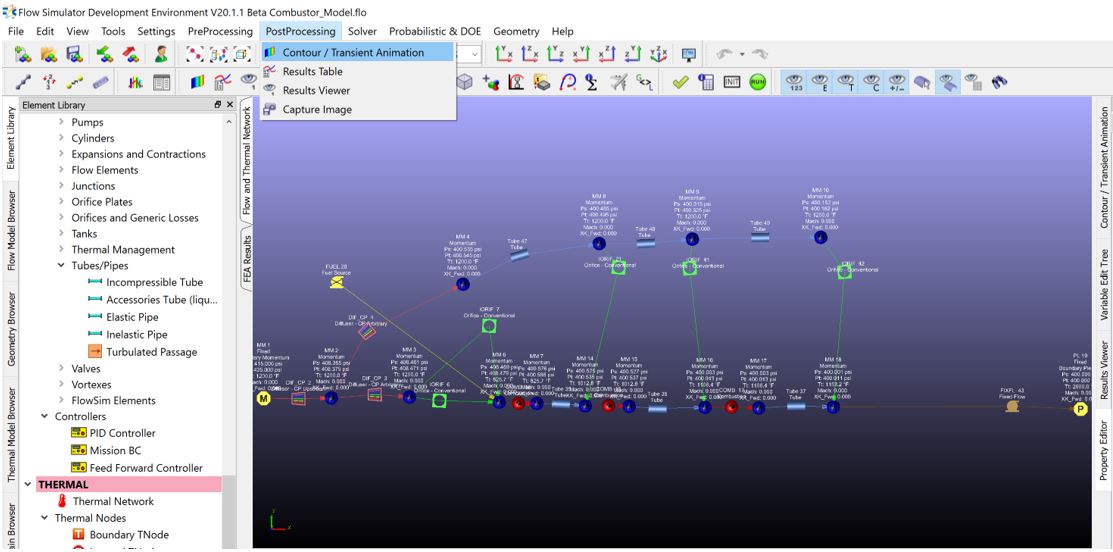 Figure 1.
 Colorize the Results in Flow Simulator
The Coloring option is located in the Contour/Transient Animation dialog. You can colorize either Initial Data or Result Data in Flow Simulator.
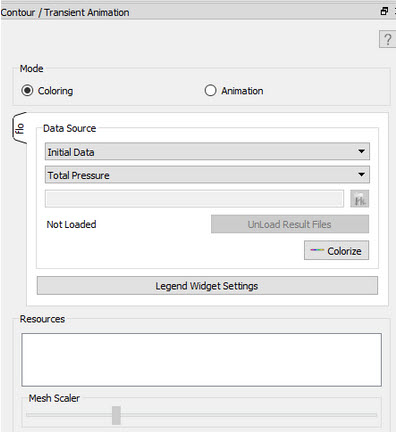 Figure 2.
 - Load results from File > Load Result File.
- Select data (Initial Data, Result Data, or Element Inputs).
- Select the object property to colorize.
- Click Colorize.
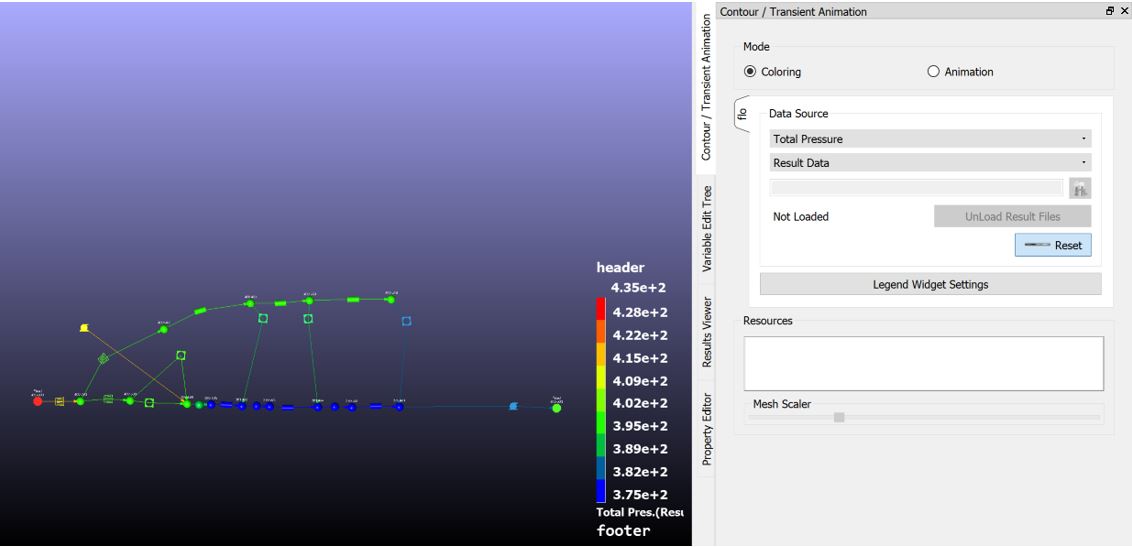 Figure 3.
 Perform a Transient Animation of the Results in Flow Simulator
In Flow Simulator, use the Animation option to see how the results change with time, elminating the need for an additional post-processing tool.
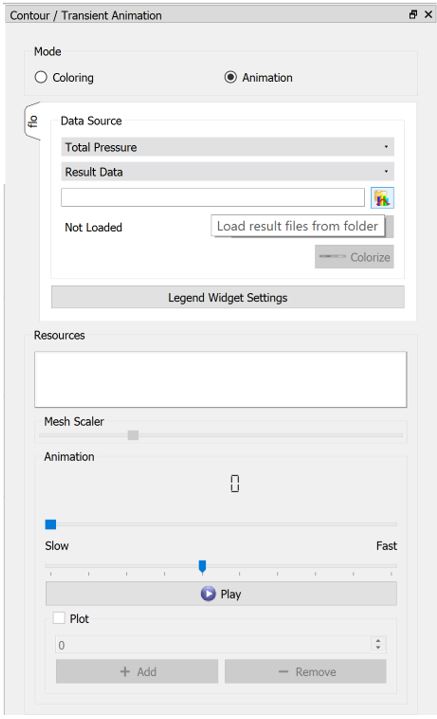 Figure 4.
 - Select this folder,
 , to
load the transient results.
 - Select the object property to be colorized.
- Select the Result Data.
- Define the animation speed by moving the bar between Slow and Fast.
- Click Play.
Legend Widget Settings
From the Contour/Transient Animation dialog, click Legend Widget Settings to display the Legend Settings dialog, where you can modify the legend settings for the color and animation options.
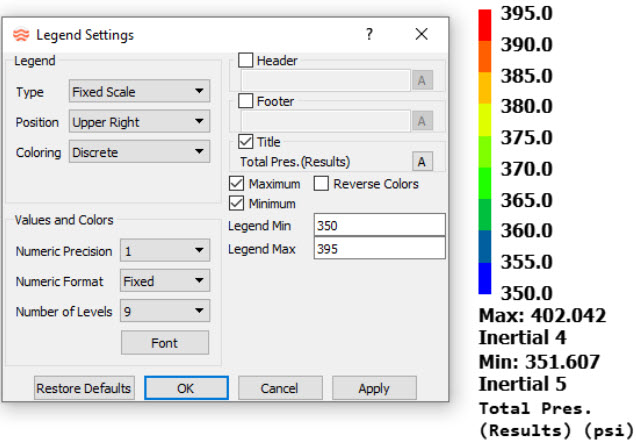 Figure 5.
 - Type
-
- Fixed Scale
- Displays a global maximum and minimum value in the legend for the time steps Flow Simulator has already processed.
- Dynamic Scale
- Changes the legend with respect to the maximum and minimum values of each time step or simulation.
- Position
- Select the position of the legend within the Flow Simulator window (Upper Left, Upper Right, Lower Left, or Lower Right).
- Coloring Type
- Currently, only Discrete color pattern options are supported.
- Numeric Precision
- You can increment the current value from 1 to 12 decimal points.
- Numeric Format
-
- Scientific
- Displays the values in scientific format.
- Fixed
- Displays the values in a fixed format.
- Number of Levels
- Displays more or less contour bands along with their respective ranges. The minimum number of bands you can display in a legend is 2; the maximum is 32.
- Font
- Change the font type and style.
- Header and Footer
- Displays the legend header and footer. To remove the header/footer, deactivate the check box. To enter a new footer, highlight the existing text, type in a new header/footer, and click Apply.
- Title
- Displays the legend title. The title reflects the settings used to generate the contour and cannot be changed. Click the font button to change the font style and size.
- Maximum/Minimum
- Displays the maximum and minimum legend values. Deselect the option to remove the minimum and maximum values from the display.
- Reverse Colors
- Reverses the legend values assigned to the contour bands.
- Legend Min
- The minimum legend value.
- Legend Max
- The maximum legend value.