Summary Post Processing
View summary of run data.
View Run Data Summary
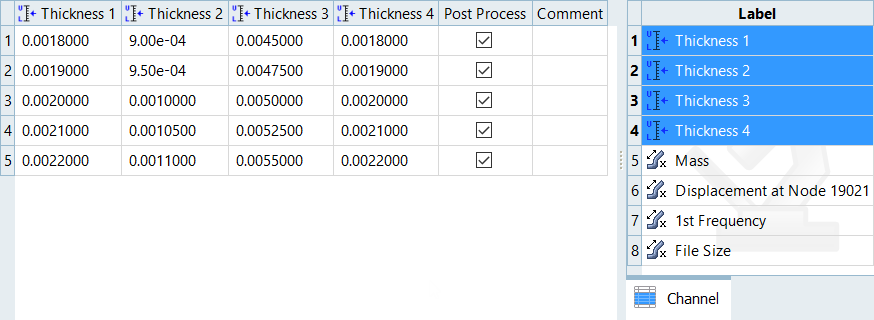
View a detailed summary of all input variable and output response run data in a tabular format from the Summary post processingEvaluation Data tab.

Figure 1.
View new features for HyperStudy 2022.1.
Learn the basics and discover the workspace.
Discover HyperStudy functionality with interactive tutorials.
Create, open, import, and save models.
A study is a self-contained project in which models, variables, output responses, and approaches are defined.
Before you can create approaches you must first setup your Study by defining input variables and output responses.
Once the study Setup is complete, an unlimited combination of approaches can be added to a study. A study approach is a specific set of steps taken to study the mathematical model of a design.
A DOE is a series of tests in which purposeful changes are made to the input variables to investigate their effect upon the output responses and to get an understanding of the global behavior of a design problem. By running a DOE, you can determine which factors are most influential on an output response.
A Fit is a mathematical model that is trained by data and is capable of predicting output response variables for a given set of input variables.
An Optimization is a mathematical procedure used to determine the best design for a set of given constraints, by changing the input variables in an automatic manner.
A Sampling Fit is a combination of space-filling DOE method and mathematical model trained by the data generated.
Add approach to the study.
Define the models, input variables, and output responses to be used in the study.
Select a numerical method to use when evaluating the Sampling Fit.
Run the approach.
View the computational results from the Sampling Fit.
Check the integrity of data.
View summary of run data.
Visualize data trends.
Analyze distributions of run data.
Analyze dependency between two sets of data.
Analyze dependency between three sets of data.
Visualize dimension reduction.
Analyze data sources.
Visualize gradients using vectors.
Analyze the response surface quality.
Identify design errors.
Perform "What If" scenarios.
Package reports for data generated during the approach.
A Stochastic approach is a method of probabilistic analysis where the input variables are defined by a probability distribution, and consequently the corresponding output responses are not a single deterministic value, but a distribution.
A Basic approach can be used to test nominal values and bounds by performing a nominal run, system bound check, or sweep.
A Verification approach compares two data sets in a side by side comparison.
Each approach in HyperStudy serves a different purpose in the design study.
Customize HyperStudy by registering solver scripts, functions, and optimizers, and defining user preferences files.
Keyboard shortcuts used to access HyperStudy features.
This section provides quick responses to typical and frequently asked questions regarding HyperStudy.
A study is a self-contained project in which models, variables, output responses, and approaches are defined.
Once the study Setup is complete, an unlimited combination of approaches can be added to a study. A study approach is a specific set of steps taken to study the mathematical model of a design.
A Sampling Fit is a combination of space-filling DOE method and mathematical model trained by the data generated.
View the computational results from the Sampling Fit.
View summary of run data.
View summary of run data.
View a detailed summary of all input variable and output response run data in a tabular format from the Summary post processingEvaluation Data tab.

© 2022 Altair Engineering, Inc. All Rights Reserved.