OS-V: 0830 Nonlinear Static Analysis with Chaboche Combined Hardening Material
Chaboche model, which is the extension of Frederick–Armstrong model, is commonly used in modeling uniaxial and multiaxial ratcheting.
The precise identification of material hardening parameters is essential for the prediction of ratcheting. Using the Chaboche hardening parameters, numerical simulations of ratcheting were done by OptiStruct. Numerical results were then compared with the experimental data obtained in a stress-controlled cyclic loading test.
Benchmark Model
- In X-direction: Constrained at all 8 nodes.
- In Y-direction: Constrained at Node ID 1,2,5, & 6.
- In Z-direction: Constrained at Node ID 1,2,3, & 4.
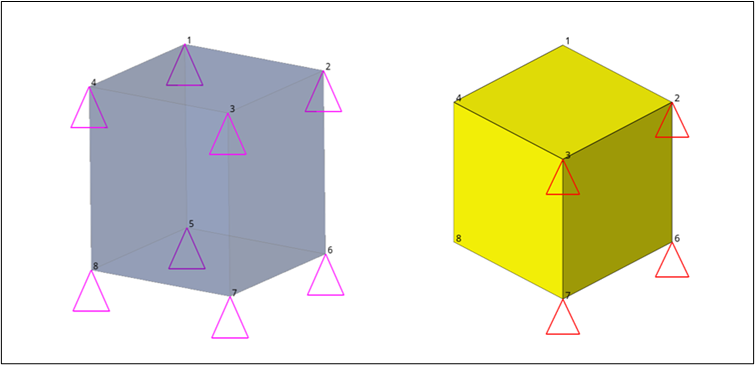
Figure 1. Model with Boundary Conditions. Left: Constraints, Right: Enforced Displacement
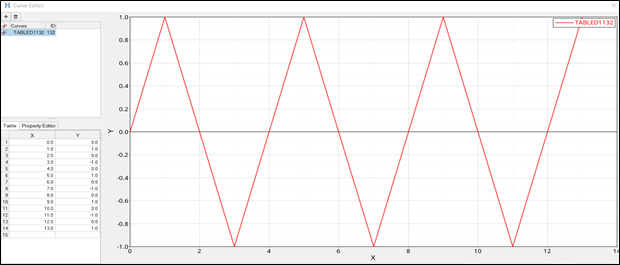
Figure 2. Time-dependent Enforced Displacement
Materials
PA6 Aluminum and combined hardening material properties:
In the Chaboche model, three nonlinear terms, as well as the voce isotropic, are used to simulate the ratcheting for PA6 aluminum. Hardening parameters for the Chaboche model are determined based on the experimental stress-strain curves obtained in strain-controlled cyclic tension/compression tests.
- MAT1
- Young's modulus (E)
- 71000 MPA
- Poisson’s Ratio (u)
- 0.33
- MATS1
- Identification of a MAT1 entry (MID)
- 21
- Hardening Rule (HR)
- 6
- Kinetic Hardening Properties
- NLKIN
- Data input for kinematic hardening.
- Number of back stresses for kinematic hardening (NKIN)
- 3
- Initial yield stress (SIGY0)
- 410.0 MPA
- Ci
- Parameter Ci of back stress components for NLKIN (PARAM) in MPA.
- C1
- 4735.0
- C2
- 1511.0
- C3
- 1554.0
- Gi
- Parameter Gi of back stress components for NLKIN (PARAM).
- G1
- 299.0
- G2
- 291.0
- G3
- 22.0
- Isotropic Hardening
- NLISO
- Data input for isotropic hardening.
- Initial yield stress (SIGY0)
- 410.0
- Parameter Q for NLISO (Q)
- 150.0 MPA
- Parameter B for NLISO (B)
- 11
Results
The results compare experimental and numerical stress-strain curves for the Chaboche model after optimization by the least-square method.
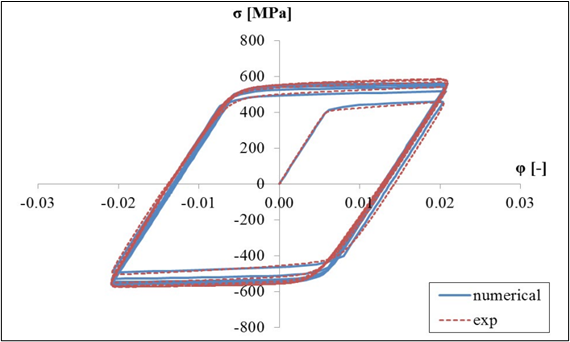
Figure 3. Reference Result
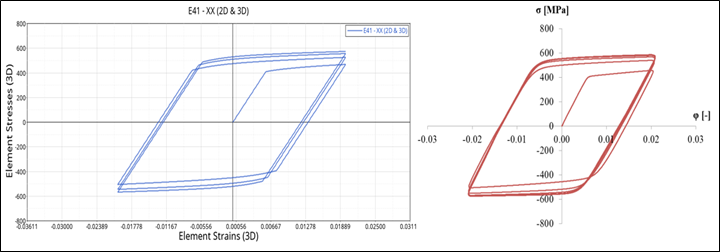
Figure 4. OptiStruct Result
The results obtained in OptiStruct, using a combined hardening material model, are similar to the experimental result.
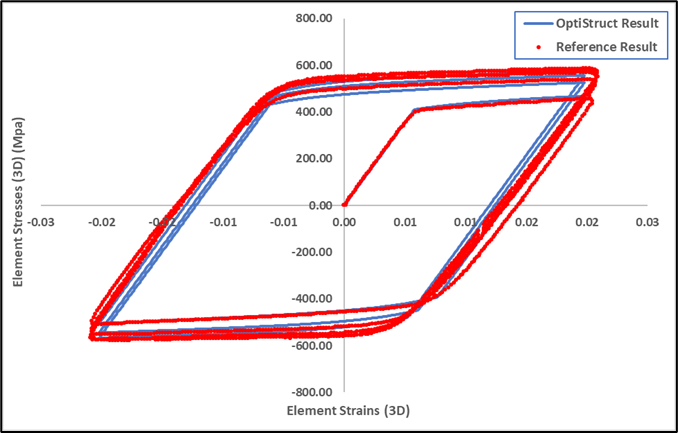
Figure 5. Superimpoased Reference and OptiStruct Result
Figure 5 shows the match between the OptiStruct results and the reference results. The OptiStruct result curves follow perfectly with reference result curves.
Model Files
Refer to Access the Model Files to download the required model file(s).
- one_element_test__subase_102_disp.fem