OS-V: 1100 Transmission Loss in a Muffler
Calculates the transmission loss using Finite Element Method in OptiStruct.
New regulations and standards for noise emission compel the industries to make some improvements about decreasing the noise emitted. The muffler attenuates the noise emitted by source (ex: engine). During the transmission of the sound across the length of the muffler, generally there is a loss (desired) which is called as the Transmission Loss. This Transmission Loss gives a value in decibels(dB) that corresponds to the ability of the muffler to dampen the noise. You will verify your results obtained using OptiStruct with an Analytical Method.
Benchmark Model

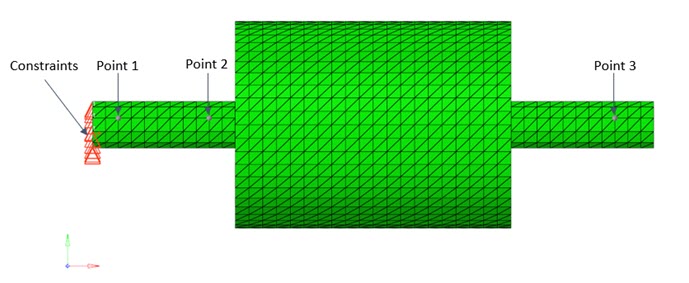
Figure 1. Finite Element Model
Material
As mentioned earlier, acoustic characteristics of the muffler can be determined with transmission loss. A simple geometry is considered which consists of an inlet pipe, an expansion chamber and an outlet pipe. Three points are considered on the muffler to tap the pressure at those points. These pressure values are used to calculate the Transmission Loss.
The finite element model, Figure 1 is meshed with tetra elements of 9.5e-3 m size. The model is fully constrained at one end and the other end is anechoic end (for example, free to radiate into space). Density and speed of sound are required as material propertries for the acoustic element.
- Property
- Value
- Density
- 1.2 kg/m3
- Velocity of Sound in Air
- 345 m/s
Results
The problem has been solved using Direct Frequency Response Analysis in OptiStruct.

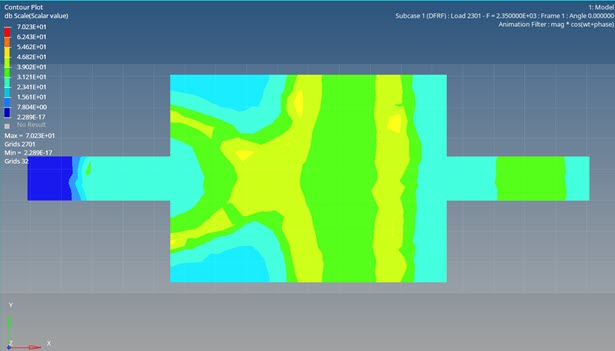
Figure 2. Contour Plot of Sound Pressure
Figure 2 shows the cut section of the muffler. Sound Pressure (db) variation across the muffler is shown for the frequency of 2350 Hz.
For both the calculations, you tap the pressure at three different points along the length of the muffler, Figure 1. These pressure values are used to calculate the Transmission Loss in both OptiStruct and the Analytical Method.
- Analytical Method, Transmission Loss is based on plane wave (2D) propagation, whereas in OptiStruct, you consider 3D wave propagation. This difference in wave type could be accounted for the small discrepancy in the results.
Verify that for most frequencies, OptiStruct results agree with the Analytical Method results.
Model Files
Refer to Access the Model Files to download the required model file(s).
- Transmission_Loss.fem
- Transmission_Loss.oml