fftshift
Shift frequency spectrum related vectors to center the dc element
Syntax
y = fftshift(x)
y = fftshift(x,dim)
Inputs
- x
- The frequency spectrum related vectors to shift.
- dim
- The dimension on which to operate.
Outputs
- y
- The shifted vectors.
Example
fft of signal with two frequency components.
This example is the same as for fft, but with
fftshift applied and the frequency axis shifted to show the negative
frequencies to the left of
0.
f1 = 25;                 % first frequency component
f2 = 40;                 % second frequency component
fs = 100;                % sampling frequency
ts = 1/fs;               % sampling time interval
n = 20;	                 % number of samples
t = [0:ts:(n-1)*ts];  % time vector
signal = sin(2*pi*f1*t) + 0.8 * sin(2*pi*f2*t);
ft = fft(signal) / n;    % normalized fft
fq = freq(n,fs,'shift'); % frequency vector
plot(fq, fftshift(abs(ft)));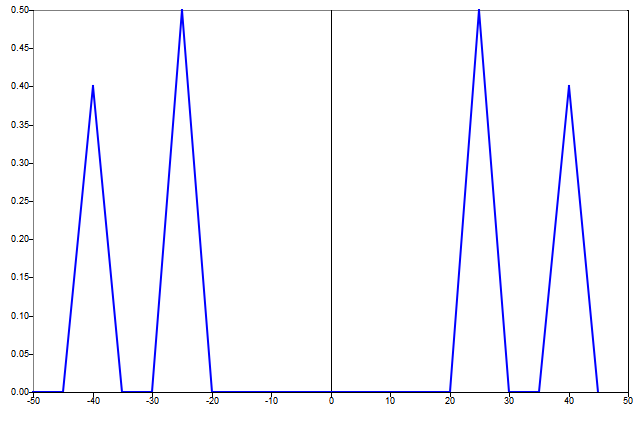
Figure 1. fft figure 1
The frequency spacing is 5 Hz, so both components fall exactly on one of the frequency vector values.
Comments
After fftshift, if a vector has an even number of samples, the Nyquist frequency of the input will become the first element of the output vector, where it is viewed as a negative frequency.