Evaluate the Model

Use the Run Analysis tool to set up and launch the evaluation.

  1. From the Evaluate tool group, click the Run Analysis tool.


    Figure 1.
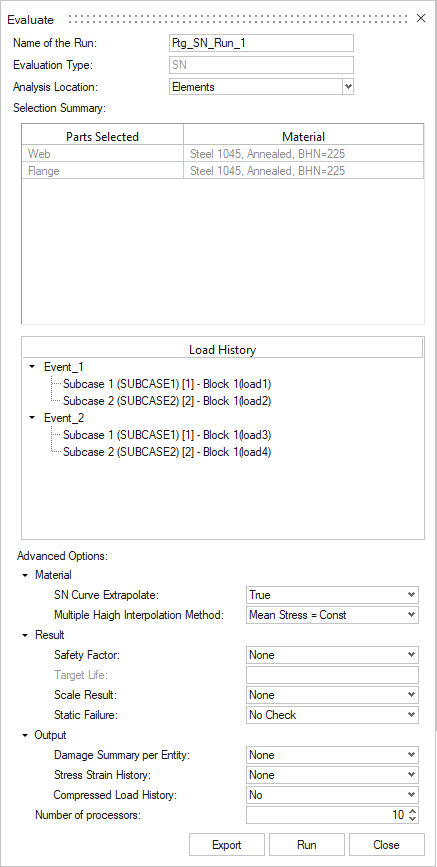
    The Evaluate dialog opens.


    Figure 2.
  2. Optional: Change the name of the run.
  3. For Analysis Location, select Elements.
  4. Review the selected parts and loadcase.
  5. Optional: Under Advanced Options and Material, define the material options.
    • SN Curve Extrapolation can be set to True/False for Multiple SN curve interpolation.
    • Multiple Haigh Interpolation Method options are Mean Stress = Constant or Stress Ratio = Constant.
  6. Optional: Under Advanced Options and Result, you can calculate the safety factor for a specified amount of target cycles for SN uniaxial runs.
    1. Change the Safety Factor drop-down to Yes.
    2. Select a criteria constant.
    3. Enter a value for the target cycles.
  7. Optional: Under Advanced Options and Result, select the Scale Result.
    You can scale Life based on Equivalent Lie units or scale Damage based on Allowable Miner Sum.
  8. Optional: Under Advanced Options and Result, define the static failure options for SN.
    • Change to Continue or Stop for Static Failure options.
    • Retain No Check to avoid Static Failure check.
  9. Optional: Define Advanced Options for output.
    Supported only for Loading types: Time series, Transient, and Modal Superposition.
    • Damage Summary per Entity: EventwiseDamage.csv will be written to Run folder. The option is activated when either an element Set or CSV with Element IDs are assigned.
    • Stress Strain History: Stress or Strain History based on Stress Life or Strain Life selected is output to the Run folder in RSP format. The option is activated when either an element Set or CSV with Element IDs are assigned.
    • Compressed Load History: Compressed load history file per event is output to the Run folder in RSP format. The option is activated by Yes/No.
  10. Optional: Click Export to export a Batch Input File.
    See for more information on batch submission.
  11. Optional: For a faster solution time, change the number of processors used for the run (based on availability).
  12. Click Run.
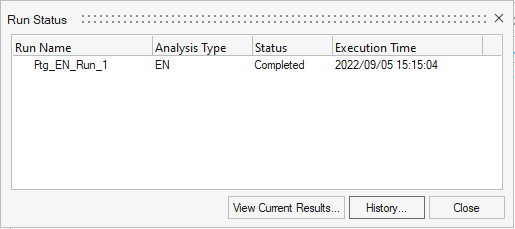
    The Run Status dialog opens.


    Figure 3.
    Note: If you do not assign any time history to an event, you are prompted about the missing channel when you click Run.
The following result files are saved to C:\Documents\Fatigue\RunHistory by default, or the home directory defined in the preferences:
Table 1.
File Type Description
*.hlf HyperLife Session File

Details related to the fatigue setup are stored in this file. It's automatically written to the working directory upon completion of a fatigue evaluation.

  • Type of fatigue analysis, material assignment, events created, and the calculated fatigue results are stored in this file.
  • Session file can be reloaded to:
    • Retrieve the setup
    • Rerun the retrieved setup
    • Review the calculated results
*.hwascii HyperLife result output
  • Hwascii lists the fatigue results of each element/node
  • Results from hwascii can also be reviewed in HyperView by loading the input result file used for the fatigue calculation (h3d, op2 , etc.) as the model file and the hwascii file as the result file.
*.h5 Rainflow/Damage matrix results
  • The rainflow/damage matrix result for each element/node are stored in an *.h5 file.
    Note: If the display of rainflow data is turned off in the Preferences dialog, this file will not be created.
  • A rainflow/damage matrix will not be displayed in HyperLife if this file is disabled in the Preferences dialog.
3DMatrixInfo_Ele<ID>.rfout

3DMatrixInfo_Node<43198>.rfout

HyperLife ASCII format results file for rainflow information of the queried element/node.

This file is created in the working directory after clicking the export icon () above the rainflow/damage matrix in the Results Explorer. Tabulated data written to the file can vary based on the fatigue solution evaluated.

For more information, see Export Damage and Rainflow Matrix Data

EventwiseDamage.csv The damage summary lists damage of each entity (element/node) per event and per layer for the selected entity list.
StressHisOut_E<ID>_Event_1_<layer>.rsp Stress or Strain history output which is not subjected to load history compression or Gate per layer and per event for the selected entity.
CompressedLoadHis_Event_1.rsp Superposed load history from an event. Intermediate points which is neither peak or valley will be removed from the history, as they do not contribute in determining any stress cycle.