ACU-T: 4201 Condensation & Evaporation - Air Box
Prerequisites
This tutorial provides instructions for running a transient simulation of an enclosed air-box using the humidity model. Prior to starting this tutorial, you should have already run through the introductory HyperWorks tutorial, ACU-T: 1000 HyperWorks UI Introduction, and have a basic understanding of AcuSolve. To run this simulation, you will need access to a licensed version of HyperMesh and AcuSolve.
Since the HyperMesh database (.hm file) contains meshed geometry, this tutorial does not include steps related to geometry import and mesh generation.
Problem Description

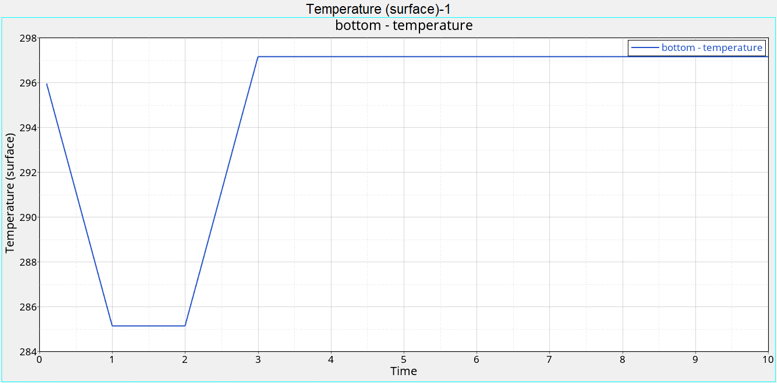
Figure 1.
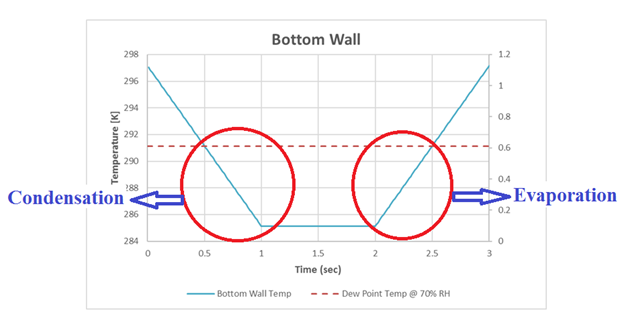
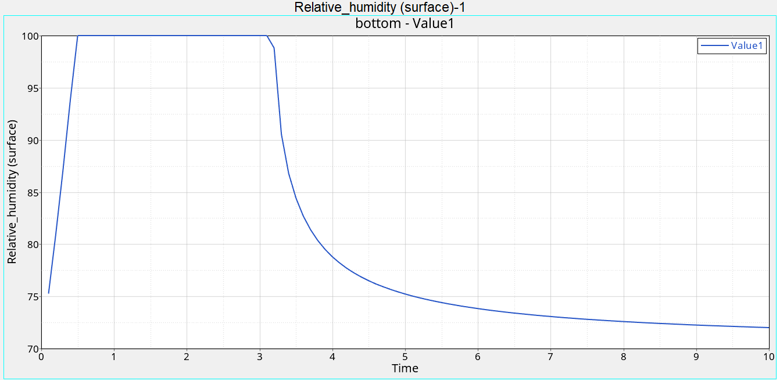
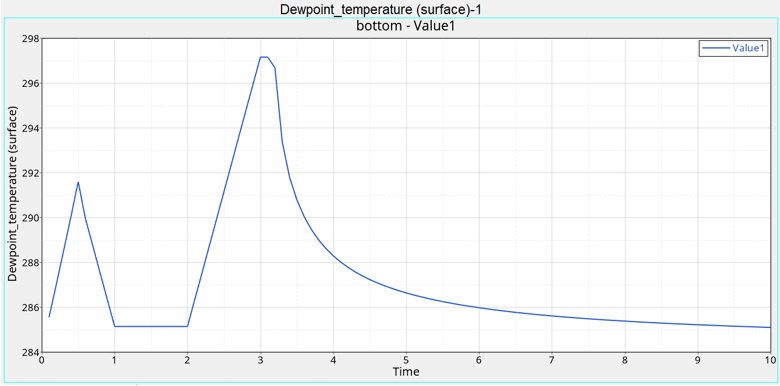
Figure 2.
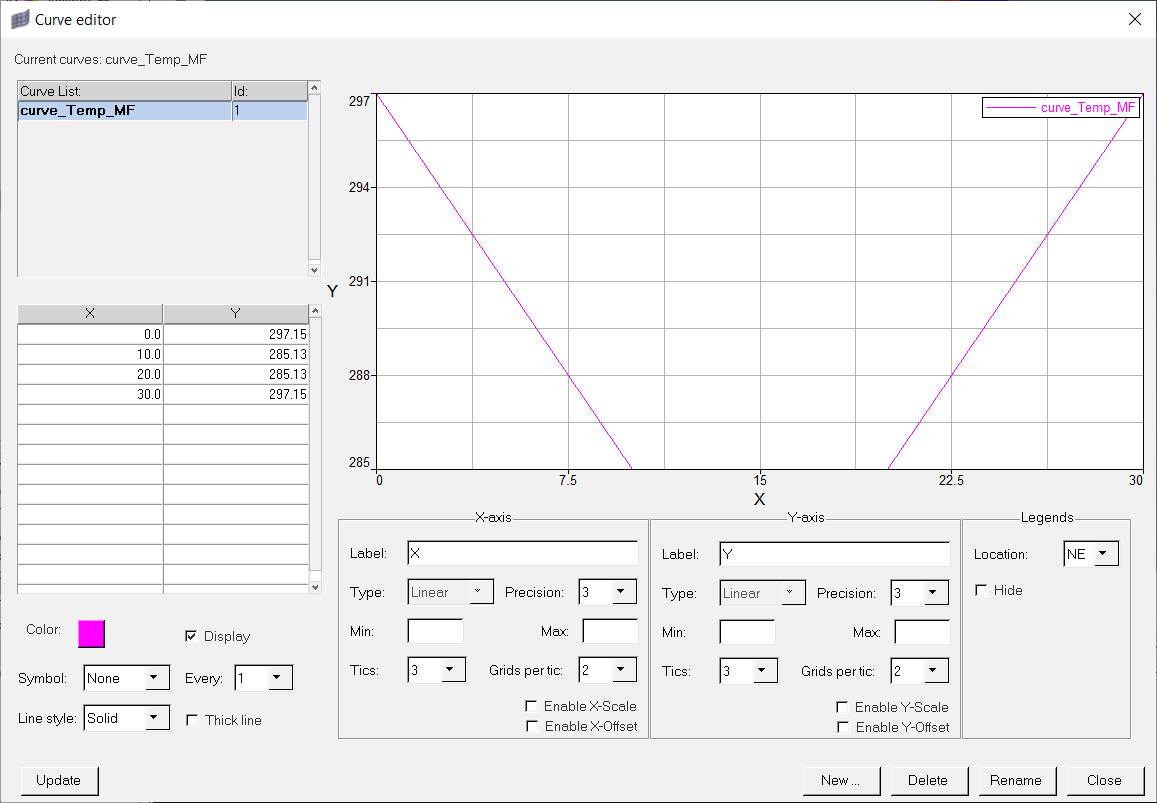
From the above plot, we can see that the Air volume initial temperature is set to 297.15 K. The Bottom Wall temperature drops to 285.13 K over 1 sec, maintains 285.13 K for 1 sec, and then rises back to 297.15 K over 1 sec. The dew point temperature of the air at 70% RH is 291.14 K and is reached at 0.5 and 2.5 sec. On the whole we can see that both condensation and evaporation occurs when the dew point temperature is reached, as explained above.
Open the HyperMesh Model Database
Set the General Simulation Parameters
Set Up Nodal Initial Conditions
Set Up Material Model Parameters and Body Force
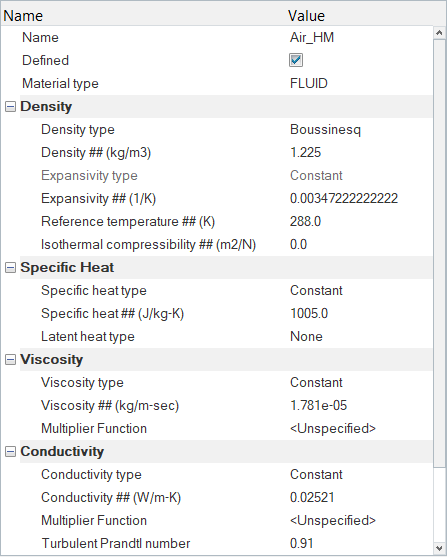
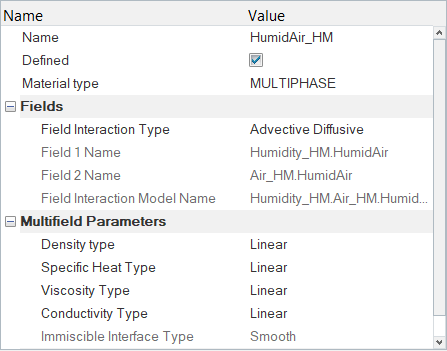
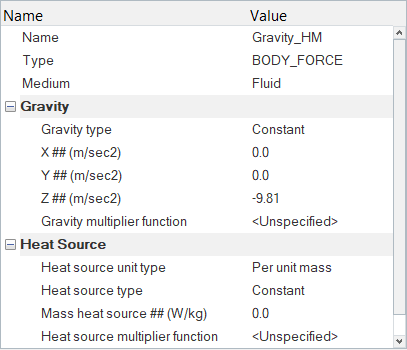
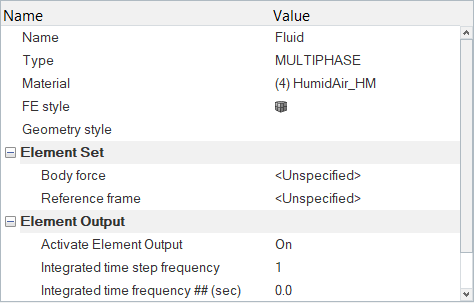
In this step, you will define the material properties for the problem and assign body force to the fluid volume.
Set Material Model Parameters
Set Up Body Force
Create a Multiplier Function
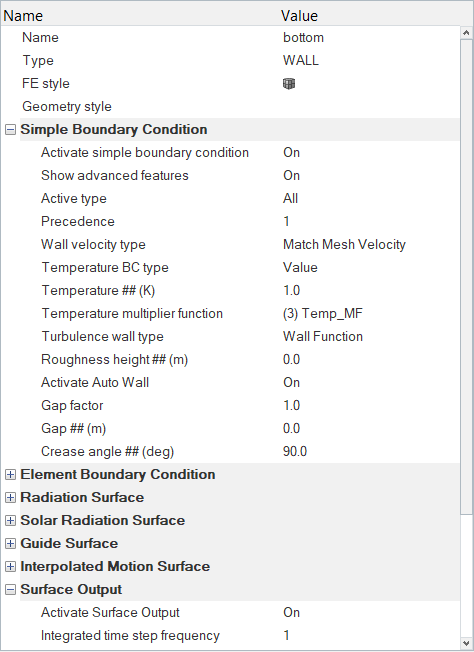
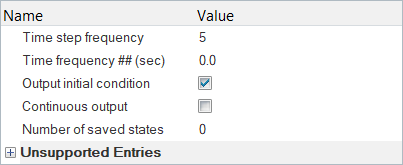
Set Up Boundary Conditions
Set Up Nodal Output Variables
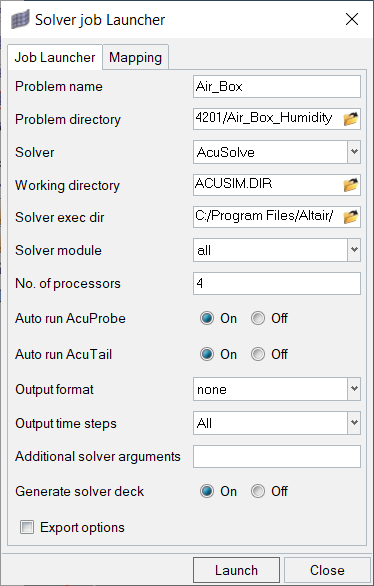
Compute the Solution
In this step, you will launch AcuSolve directly from HyperMesh and compute the solution.
Monitor the Solution with HyperGraph
Post-Process the Results with HyperView
Open HyperView and Load the Model and Results
Create Contours on a Cut Plane
Summary
In this tutorial, you worked through a basic workflow to set up and solve a transient multiphase flow problem using HyperMesh and AcuSolve. You also learned how to use the humidity model to quantify accumulation and loss of water vapor on the bottom wall surface due to temperature change. Once the solution was computed, you monitored the solution in HyperGraph and post-processed the results in HyperView, where you created contour plots.


 on the Standard Views toolbar.