HG3D-3000: Define Line Plots
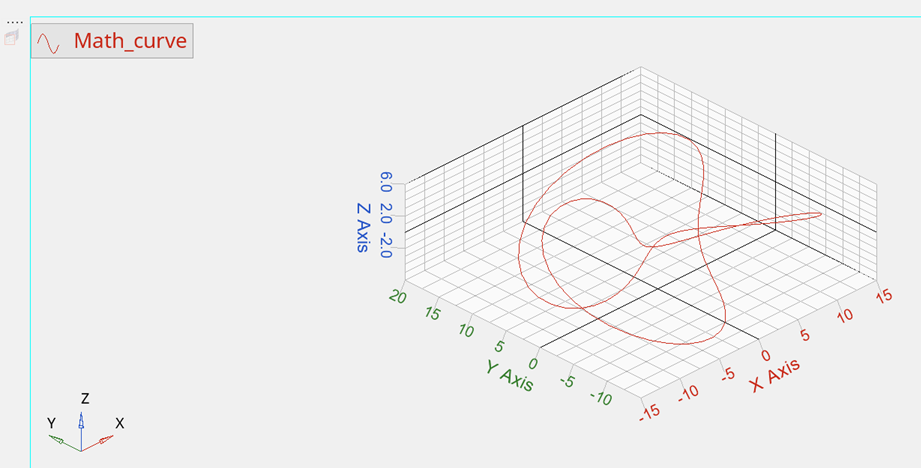
In this tutorial, you will learn how to create line plots from a file and create line plots using a math expression.
- From the HyperGraph 3D toolbar, click the Define
Curves icon,
 .
. - From the menu bar, select

Figure 1.

Figure 2.
The Define Curves panel enables you to edit existing curves and create new ones. New data can be selected from a source file, mathematically defined using the program's curve calculator, or entered as values. The options in the panel change depending on which source is selected. If the source chosen is Math, the panel looks as shown below:
The Curve list displays the names of all curves in the active window. Curves can be renamed, added, cut, copied, and pasted using the curve list controls.
 , to add a page or press the
