*BarChartStyle()
Specifies the styles of the bar chart curves.
Syntax
*BarChartStyle (mode, labeling, gap, orientation)
Application
HyperGraph
Inputs
- mode
- Determines if the bar chart(s) is displayed in stack (1) or cluster (0) mode.
- 1
- Stack bar chart.

Figure 1. - 0
- Cluster bar chart.
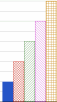
Figure 2.
- labeling
- Determines if there is a bar chart label.
- 1
- Puts the total value of the bar charts on top of the bar chart stack as the label.
- 0
- No label.
- gap
- The percentage of the gap of a category interval.
- orientation
- Determines if the bar chart is displayed horizontally or vertically.
- 0
- Horizontal bar chart (the horizontal axis is the category axis).
- 1
- Vertical bar chart (the vertical axis is the category axis).
Context
*BeginPlot()
Example
*BeginPlot()
    *PlotType(1)
    *BarChartStyle(0, 0, 20, 0)
    *BeginLegend(On)
        *Font("Arial", 0, 0, 8)
        *BorderWidth(1)
        *Color(0)
        *Leader(Left)
        *Location(INSIDE)
        *Postion(4.4683, 11.8871, 5.22495, 9.37412)
    *EndLegend()
• • •
*EndPlot()