Show Fluids Results
View the results of a Fluids simulation in the Analysis Explorer.
On the Fluids ribbon, select the View Fluids Results
tool in the Analyze Fluids tool group.

Analysis Explorer Options
The Analysis Explorer includes the following options.
Run
The most recent analysis run is shown in the modeling window by default. To view the
results from a different analysis, click on the appropriate item in the list of runs
at the top of the Analysis Explorer.
To delete a run from the Analysis Explorer, right-click the run name to select Delete Run.
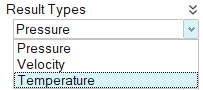
Result Types
Fluids analysis produces a variety of different result types including pressure,
velocity, and temperature. Click on an item in the Result Types list to view the
results.
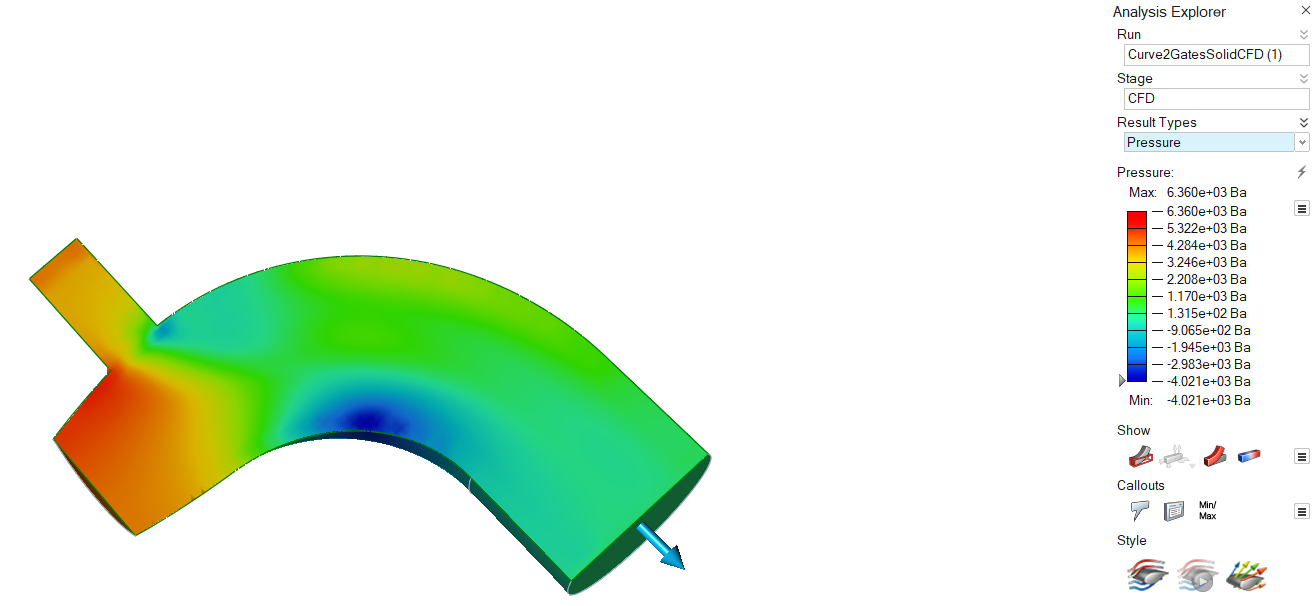
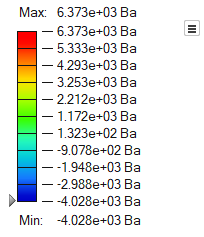
Pressure
The pressure result type shows how much pressure your model is under when fluids are
applied. The areas of the model that are the reddest have the most pressure.
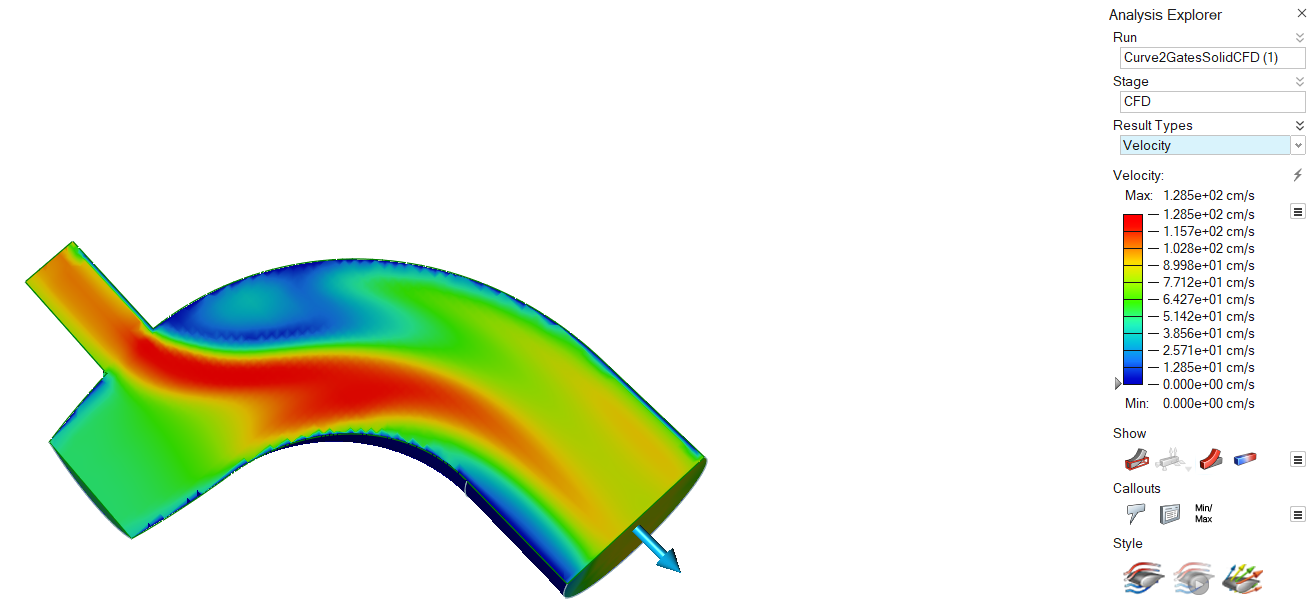
Velocity
The velocity result type shows how much velocity your model is under when fluids are
applied. The areas of the model that are the reddest have the most velocity.
Temperature
The temperature result type shows how much temperature your model is under when
fluids are applied. The areas of the model that are the reddest have the highest
temperature.
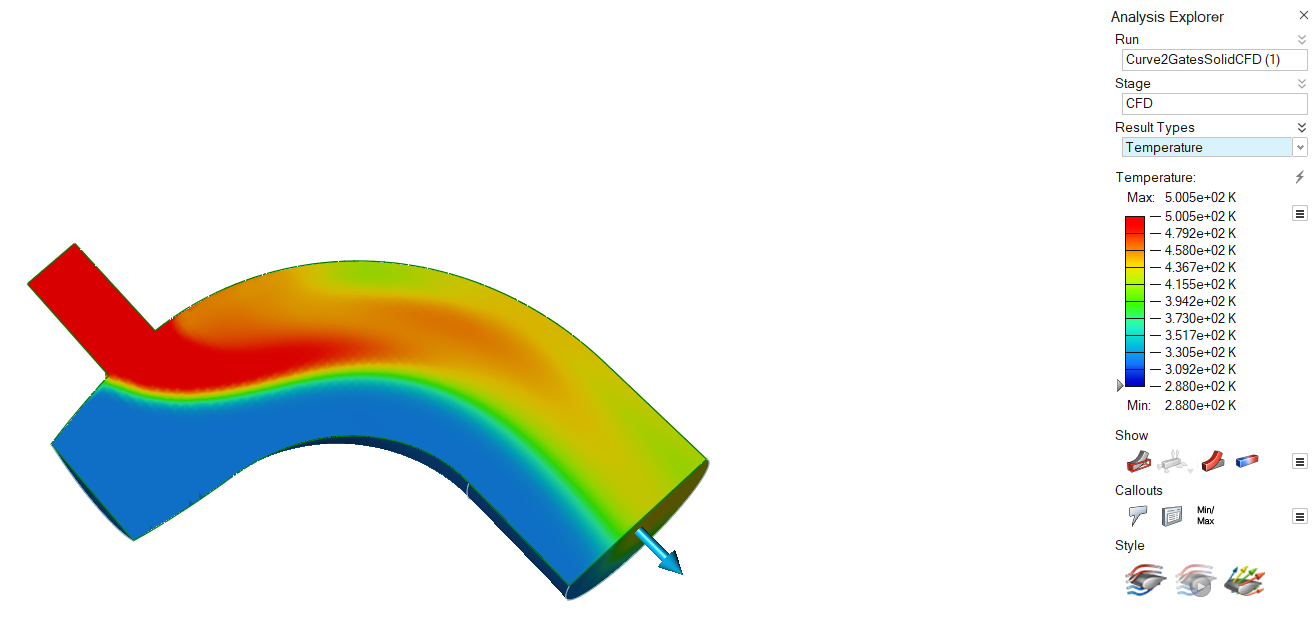
Results Slider
The results slider is scalable and provides a color gradient for the selected result
type.
- To change the upper or lower bound for the results slider, click on the bound and enter a new value. Click the reset button to restore the default values.
- To filter the results so that areas on the model with results greater than a
specified value are masked, click and drag the arrow on the results slider.
To mask areas with results less than the specified value, click
 and select Flip
Mask. Select the arrow to enter a specific value.
and select Flip
Mask. Select the arrow to enter a specific value. - To change the legend color for the result type, click the icon next to the results slider and
select Legend Colors.
Show/Hide Elements
When the Analysis Explorer is active, an additional Show/Hide
Elements
![]()
![]() icon appears under the view controls in the lower left
corner of the modeling window.
icon appears under the view controls in the lower left
corner of the modeling window.
Show Options
Determine what is made visible in the modeling window when viewing analysis results. You can show or hide the initial shape, loads and supports, deformation, and contours.
| Option | Description | Note | |
|---|---|---|---|
| Options |
|
||
| Show/Hide Elements | Show/hide the element edges. | This icon appears under the view controls in the lower left of the modeling window, but only when the Analysis Explorer is active. | |
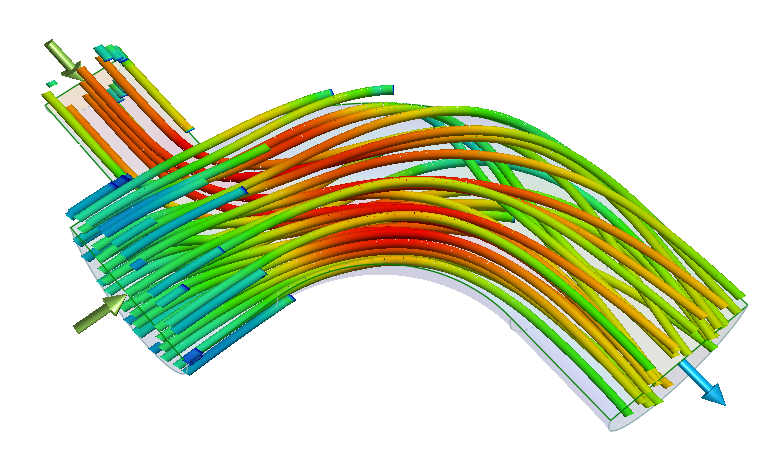
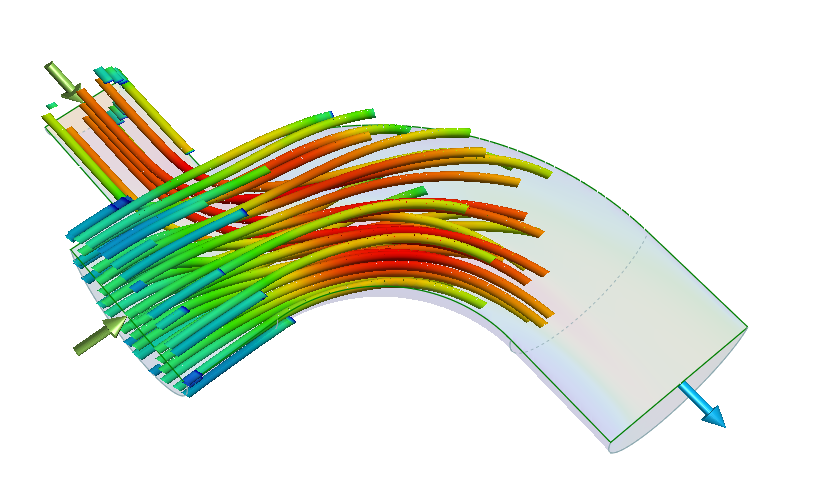
Style Options
Visualize the results as static streamlines, animated streamlines, or vectors.
| Option | Description |
|---|---|
| Static Streamlines |
Visualize the results as static streamlines. In the microdialog, you
can adjust the following parameters:
 |
| Animated Streamlines |
Only available if Streamlines is turned
on. Click the icon once to visualize the results as animated
streamlines. Click the icon again to jump to the end of the
animation.
 |
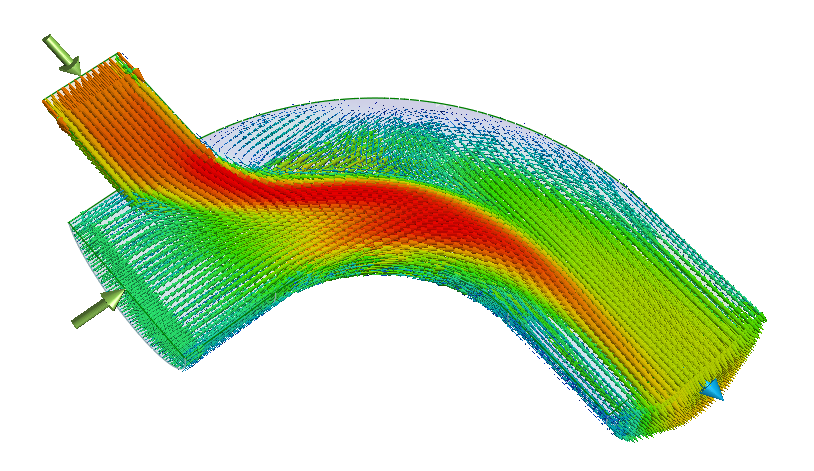
| Vectors |
Visualize the results as vectors. In the microdialog, you can adjust
the following parameters:
 |