rainflow
Rainflow counting fatigue analysis.
Syntax
R = rainflow(signal,numbins,minrange,maxrange,output)
Inputs
- signal
- The stress history.
- numbins
- Total number of bins specified.
- minrange
- Minimum value a bin can have for its range of real time data.
- maxrange
- Maximum value a bin can have for its range of real time data.
- output
- Indicate the type of data returned.
Outputs
- R
- The reduced stress history.
Example
Compute the rainflow output of a stress history.
h = [0,1,2,3,4,5,6,5,4,3,4,5,6,7,8,9,10];
R = rainflow(h, 3, 2.5, 8.5, 1)
R = [Matrix] 1 x 3
3.50000 5.50000 7.50000Use a 3D bar plot to visualize the mean x range x cycle results of a signal.
f=5; %frequency [Hz]
t1 = (0:1/(f*100):2); %first time vector
t2 = (t1(end):1/(f*100):t1(end)+1); %second time vector
a = 1; %amplitude
phi = 0; %phase
y1 = a*sin(2*pi*f*t1+phi); %first signal
y2 = 5*sin(2*pi*f*t2+phi); %second signal
y = [y1 y2]; %append the two signals
t = [t1 t2]; %append the two time vectors
Signal=y;
nbin = 19;
R2=rainflow(Signal,nbin, min(Signal), max(Signal),2);
bar3(R2);
xlabel('Range');
ylabel('Mean');
zlabel('cycles');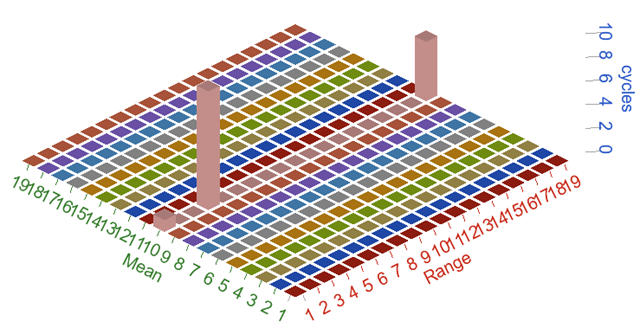 Figure 1. rainflow
Comments
A gate input to control hysteresis slope reversal and remove points due to external noise is currently unsupported.
The three point cycle counting rule uses three consecutive points in a load time history to determine whether a cycle is formed.
The three consecutive stress points (S1, S2, S3) define the two consecutive ranges as DS1 = |S1 S2| and DS2 = |S2 S3|. If DS1 < = DS2, one cycle from S1 to S2 is extracted, and if DS1 is > than DS2, no cycle is counted.
The three point cycle counting method requires that the stress time history be rearranged so that it contains only the peaks and valleys and it starts with either the highest peak or the lowest valley, whichever is greater in absolute magnitude.
Then, the cycle identification rule is applied to check every three consecutive points from the beginning until a closed loop is defined. The two points forming the cycle are discarded and the remaining points are connected to each other. This procedure is repeated from the beginning until the remaining data are exhausted.