image
Display a matrix as an image, based on the current color map.
Syntax
h = image(z)
h = image(x, y, z)
h = image(property, value...)
Inputs
- z
- Matrix specifying the data for the matrix to be displayed. This can also be specified by the property 'cdata'.
- x
- Optional vector to specify the maximum and mininum values of the x-axis.
- y
- Optional vector to specify the maximum and mininum values of the y-axis.
- property, value
-
- 'cdata'
- Specifies the data which is displayed by h. This is the same as specifying z.
- 'displayname'
- Specifies the label displayed on the color map associated with h.
- 'parent'
- Specifies the parent (figure). Once h has been created, it cannot be re-parented to a different figure.
- 'tag'
- User-defined string to tag graphical control objects.
- 'userdata'
- User-defined numerical data.
- 'visible'
- Specifies if h is visible. Valid values are 'on'(default) and 'off'.
- 'xdata'
- Specifies the maximum and minimum values of the x-axis. This is the same as specifying x.
- 'ydata'
- Specifies the maximum and minimum values of the y-axis. This is the same as specifying y.
Outputs
- h
- Handle of the image object.
Examples
Set the legend display and userdata:
z1 = [27 2 3; 4 5 36; 7 8 9];
h = image(z1, 'displayname', 'My title', 'userdata', [50, 51]);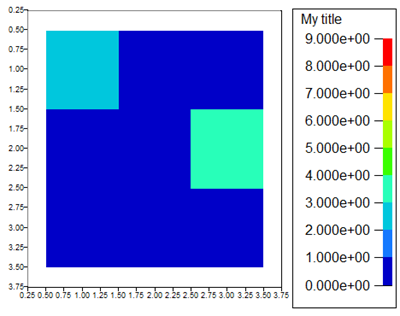 Figure 1. Display legend title.
Update values:
h = image([1 2 3; 4 5 6; 7 8 9]);
set(h, 'xdata', [1 15], 'ydata', [2 5], 'cdata', 100*eye(4));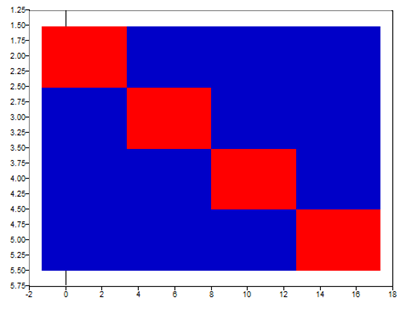 Figure 2. Update the data of an image.
Reposition and scale image:
h = image(50*eye(4));
hold on;
h = image([6 10], [5 8], 100*eye(4));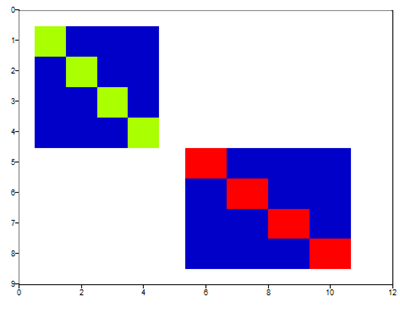 Figure 3. Repositioned and scaled image.
Comments
If there are no axes, they will be created first. If x and y are omitted, the index of the z columns is used for the x coordinates and the index of the z rows is used for the y coordinates.