colormap
Gets or sets the colormap of a figure or axes.
Syntax
cmap = colormap()
cmap = colormap(handle)
colormap(cmap)
colormap(cmapname)
colormap(handle, cmap)
Inputs
- handle
- The handle of the figure or axes.
- cmap
- n x 3 matrix to set the colormap.
- cmapname
- Colormap name. Available options are:
Outputs
- cmap
- The current colormap.
Example
Simple colormap
example.
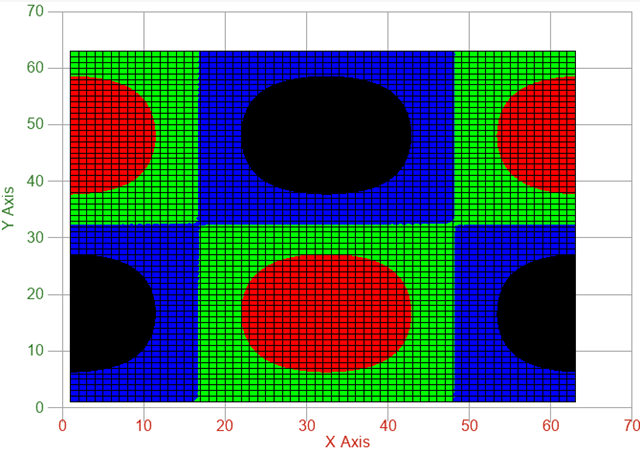
x=[0:0.1:2*pi];
y=x;
z=sin(x')*cos(y);
contour(z)
cmap = [1 0 0;0 1 0; 0 0 1; 0 0 0];
colormap(cmap)
Simple colormap example using 'viridis colormap'.
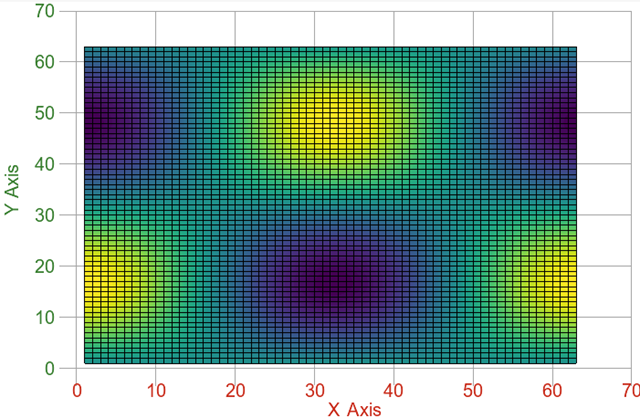
x=[0:0.1:2*pi];
y=x;
z=sin(x')*cos(y);
contour(z)
colormap('viridis')
Comments
The maximum number of colors in the colormap is 32.