axis
Sets the scaling and range of x, y, and z axes (x by default). Called without arguments, axis turns autoscaling on.
Syntax
axis()
axis([X_lo X_hi])
axis([X_lo X_hi Y_lo Y_hi])
axis([X_lo X_hi Y_lo Y_hi Z_lo Z_hi])
axis(option)
Inputs
- X_lo, X_hi
- Lowest and highest x ranges.
- Y_lo, Y_hi
- Lowest and highest y ranges.
- Z_lo, Z_hi
- Lowest and highest z ranges.
- option
- Takes one of the following values:
- 'bestfit'
- The length of each axis is adjusted to maximize the graphics area (3D plots only).
- 'cubical'
- The length of each axis is the same (3D plots only). This is the default value.
- 'equal'
- Sets uniform aspect ratio to the axes (2D plots only).
- 'normal'
- Resets the aspect ratio (2D plots only).
- 'on'
- Enables the visibility of the axes' ticks and labels.
- 'off'
- Disables the visibility of the axes' ticks and labels.
- 'square'
- Sets square aspect ratio to the axes (2D plots only).
- 'tight'
- Sets the axes range equal to the data limits.
- 'unscaled'
- The length of each axis is based on the axis values (3D plots only).
Examples
Simple axis
example:
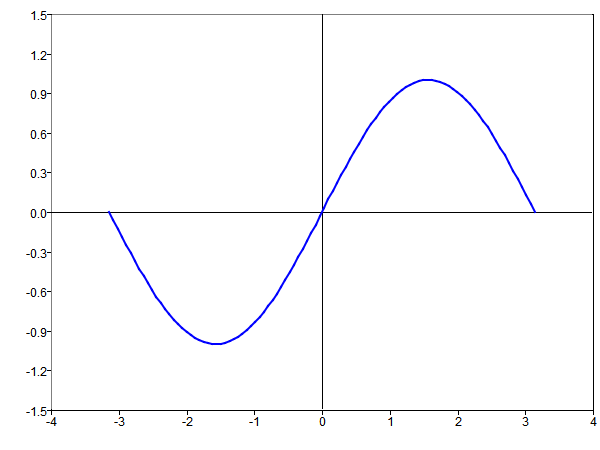
Figure 1. Simple axis example
clf;
x=linspace(-pi,pi, 100);
plot(x,sin(x));
axis ([-4 4 -1.5 1.5])
Figure 1. Simple axis example
axis('equal')
example:
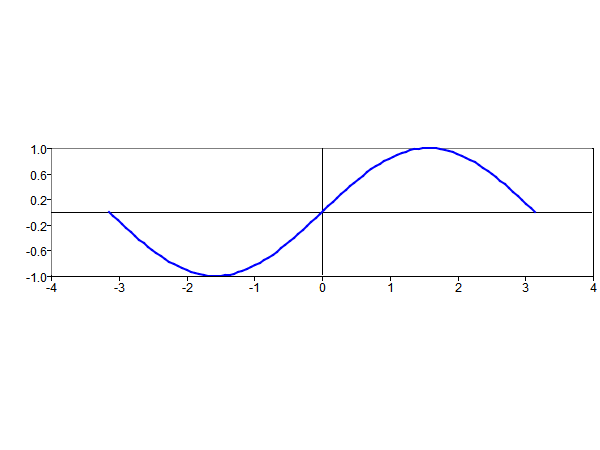
Figure 2. Uniform aspect ratio
clf;
x=linspace(-pi,pi, 100);
plot(x,sin(x));
axis('equal');
Figure 2. Uniform aspect ratio
axis('square')
example:
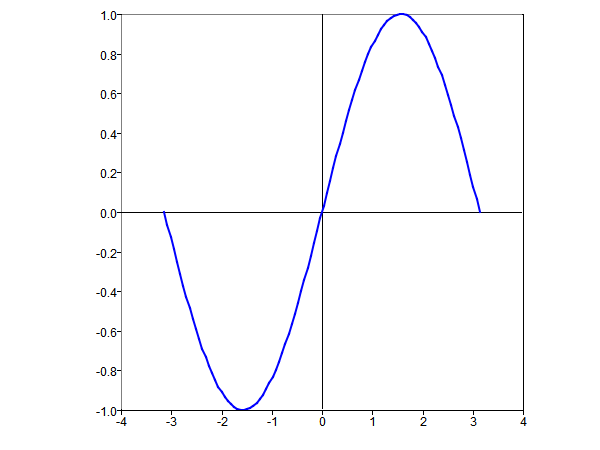
Figure 3. Square aspect ratio
clf;
x=linspace(-pi,pi, 100);
plot(x,sin(x));
axis('square');
Figure 3. Square aspect ratio
axis('tight') example:
clf;
x=linspace(-pi,pi, 100);
plot(x,sin(x));
axis('tight');
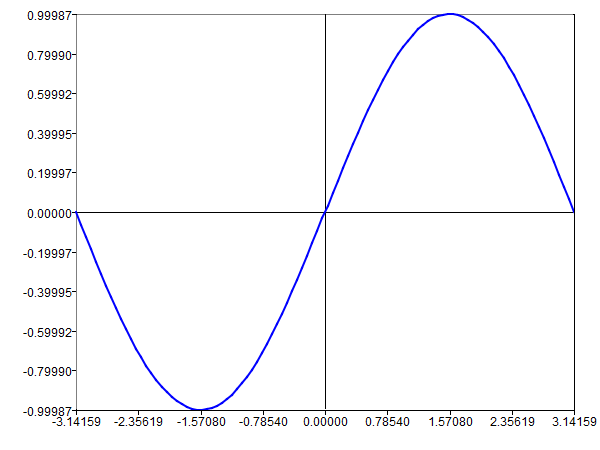
Figure 4. Tight fit to curve data
axis('bestfit')
example:
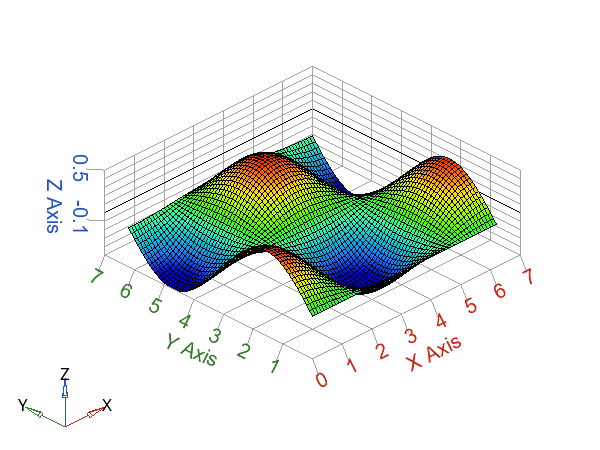
Figure 5. Best fit axes
clf;
x=[0:0.1:2*pi];
y=x;
z=sin(x')*cos(y);
s=surf(x, y, z)
axis('bestfit');
Figure 5. Best fit axes
axis('unscaled') example:
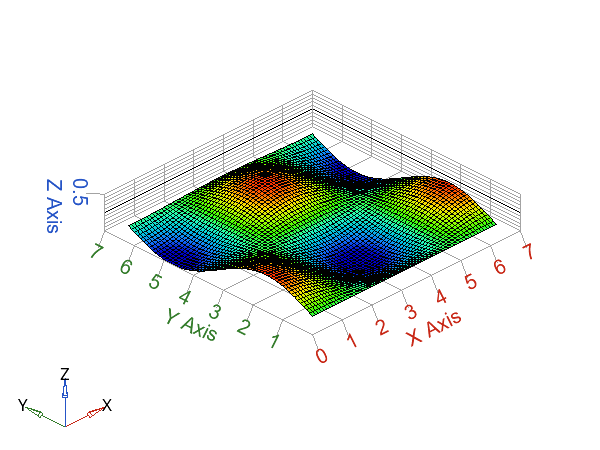
Figure 6. Unscaled axes
Figure 6. Unscaled axes
clf;
x=[0:0.1:2*pi];
y=x;
z=sin(x')*cos(y);
s=surf(x, y, z)
axis('unscaled');