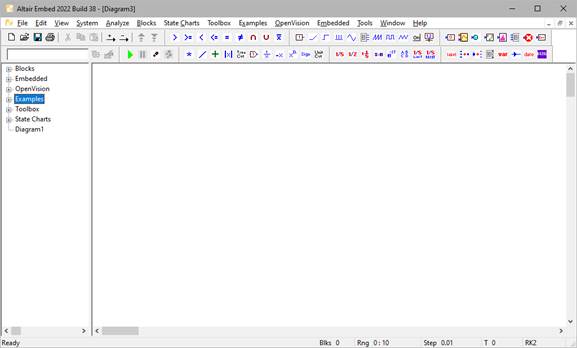
When you start Embed for the first time, an Embed window is opened containing an empty block diagram named Diagram1.
The title bar displays the name of the currently opened diagram and your current location in the diagram. If your diagram contains unsaved changes, an asterisk is appended to the diagram name.
The work area is the largest part of the window. Here you build your models in block diagram form. A block diagram provides a clear and concise graphical representation of the mathematics of a system model. It is composed of blocks connected by wires that pass signals, or data, from one block to another.
The menu bar contains drop down menus for all commands and blocks.
You can customize the menu bar with your own menu items, commands, and blocks using the Edit > Preferences > Menu Directories command.
Commands and blocks can also
be accessed from the Browser windowpane, toolbar, pop-up menus, and short-cut
keyboard commands. For example, to open a new diagram, you select File > New
from the menu, or you can click the  toolbar button.
Toolbar buttons represent commonly used commands and blocks. As you drag the cursor over a toolbar button, a pop-up description of the button appears. To select a toolbar button, just click on it.
Toolbar buttons are grouped in nine categories: Annotation Blocks, Arithmetic Blocks, Boolean Blocks, Consumer Blocks, Dynamic Blocks, Main, Sim Control, User, and Producer Blocks. By default, the Main and Sim Control toolbars appear when you start Embed. The six Blocks toolbar contain the most commonly used blocks from the corresponding block category. The User toolbar lets you create your own toolbar buttons.
|
To |
Do this |
|
Display or hide toolbars |
Select View > Tool Bar. |
|
Move a cluster of toolbar buttons |
Drag the toolbar cluster to where you want it to appear. |
|
Create custom toolbar buttons |
|
|
Change the button size |
Select View > Tool Bar. |
Sometimes, when a toolbar button is dimmed, it is because the last mouse position was in the left windowpane. Click the mouse anywhere in the right windowpane to activate all available toolbar buttons.
The Blocks and Diagram Browser windowpane provides a convenient way to insert blocks into a diagram and navigate within a multilayer diagram.
The upper part of the windowpane lists standard blocks, OpenVision blocks, Toolboxes, and State Chart blocks. The windowpane includes the Embedded blocks, Comm blocks, and Digital Power blocks, if you have these add-ons.
The lower part of the windowpane displays the hierarchical structure of the currently open block diagram. The + and – signs that precede each level let you expand and contract the level. Click on a level to display it in the work area.
As your models become larger and more complex, finding easy ways to move around your diagram is essential. The scroll bars that run along the bottom and right side of the Embed window let you pan to sections of your diagram that are not currently visible on the screen. To hide or show the scroll bars, use the Edit > Preferences command.
You can also use the  toolbar buttons
to shrink or enlarge the diagram.
toolbar buttons
to shrink or enlarge the diagram.
The status bar displays information about the current state of your diagram, including the total number of blocks in the diagram, along with the specified simulation range, step size, and integration algorithm. If the simulation is running, the current simulation time is also displayed. The status bar appears in the lower right corner of the Embed window.
When you drag the mouse over a menu, menu command, or toolbar button, Embed displays a brief description of the item in the status bar.
Use the View > Status Bar command to show or hide the status bar.