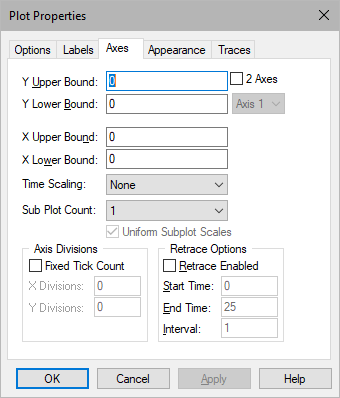
2 Axis: Enables right side plot axis. You can then select Axis 1 or Axis 2. The 2 Axis checkbox is available only if Sub Plot Count is set to 1.
Fixed Tick Count, X Division, Y Division: You can override the plot’s grid tick division by activating Fixed Tick Count and entering values to X Divisions and Y Divisions. The numbers you enter indicate the number of grid ticks on each axis.
Allows you to configure a plot as an eye diagram.
Retrace Enabled: Activate Retrace Enabled and specify the desired interval in Interval. In Start Time and End Time, enter the start and end times for the eye diagram. Eye diagrams are particularly useful for analyzing digital data waveforms.
Sub Plot Count: Specifies up to eight subplot windows, allowing you to plot each signal trace in a separate window. This feature is useful when signal traces overlap in range and obscure each other.
Time Scaling: Specifies x-axis scaling in microseconds, milliseconds, seconds, minutes, hours, and days. When you select a different time axis scale, Embed re-calculates the values in X Upper Bound and X Lower Bound. When you close the dialog box, the x-axis is scaled to the time you chose.
Uniform Subplot Scales: Controls whether subplots are uniformly scaled. This parameter is available when you have two or more subplots.
Y Upper Bound, Y Lower Bound, X Upper Bound, and X Lower Bound: Specify the upper and lower bounds for the x and y axes. These bounds are in effect when you activate Fixed Bounds under the Options tab.