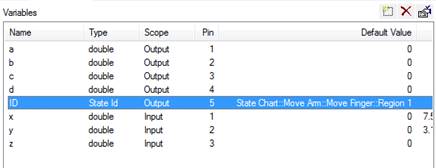
 . For example:
If you select the special data type State Id, you can produce a unique numeric identifier of the currently active state. This can be plotted during the course of a simulation to trace system behavior.
If there are nested regions in the state chart, the state chart can have multiple active states: one in each active region.
To configure a state Id data type in multiple active regions
1.
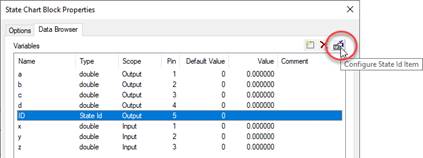
In the Data Browser window for the State Chart Properties dialog
box, select the variable state ID and click on  . For example:
 an
an
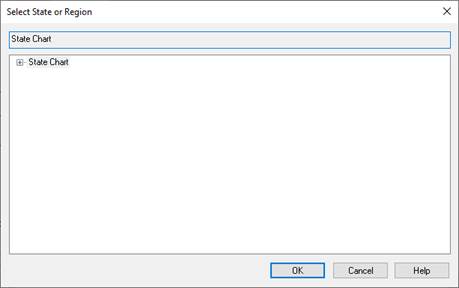
The Select State or Region window appears. For example:
2. Click the plus (+) signs to expand the state chart tree. For example:
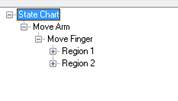
3. Select a state or region. For example:
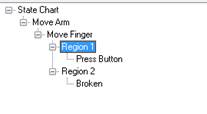
4. Click OK.
The selected state or region will be displayed under Default Value in the Data Browser. For example:
