Plotting an impedance curve
2D curves (evolution)
A 2D curve (evolution) is a curve representing a physical quantity according to the frequency. In the Conductors Impedances application the self and mutual impedances seen from the impedance probes are the only quantities available.
To create a 2D curve (evolution) the user has to:
| Step | Action | Result |
|---|---|---|
| 1 |
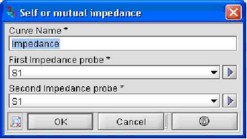
Open the dialog box 2D curve (evolution):
|
|
| 2 |
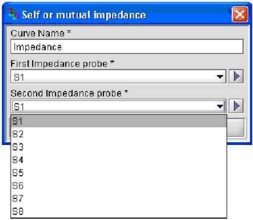
Give a name to the 2D curve and select the two probes among which to plot the impedance. If the same probe is selected in both boxes, a curve with the self impedance will be plotted; otherwise it will be a curve with mutual impedance |
|
| → | The 2D curves are displayed in a new specific sheet with the name of the physical quantity considered. | |