Compare Results
Compare the results of multiple analysis runs in a table. The Compare Results button is located at the bottom of the Analysis Explorer.
For analysis, you can compare results across all runs and load cases for the selected result type. You can also compare result types at a point of interest where you have placed a callout.
-
Click the Compare Results button located at the bottom
of the Analysis Explorer.

The table for comparing results appears at the bottom of the modeling window.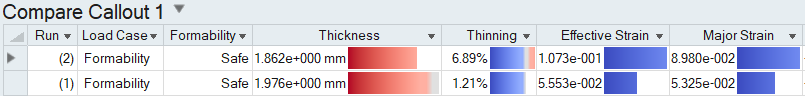
Additional columns can be added to show additional result types and parameters from the Run Analysis window. The red-blue color bands correspond to the legend in the Analysis Explorer; the width of the band indicates the magnitude of the result. Changes to the upper and lower bound in the Analysis Explorer are automatically reflected in the Compare Analysis Results table.