Measure the result of two variables moving simultaneously.
Analyze Interactions
Analyze the effect of an input variable on an output response at varying levels of
other input variables in the Interactions post processing tab.
An interaction is the failure of one input variable to produce the same effect on the
output response at different levels of another input variable. In other words, the
strength or the sign (direction) of an effect is different depending on the value
(level) of some other variable(s). An interaction can be either positive or
negative.
From the Post Processing step, click the Interactions
tab.
Using the Channel selector, select the input variable(s) and output response(s)
to analyze.
Change the format to display interactions by switching the view between (Interactions Plot) and (Interactions Table).
Analyze interactions.
Tip:Display selected data in a single
plot or separate plots by switching the Multiplot option between (single plot) and
(multiple
plots).
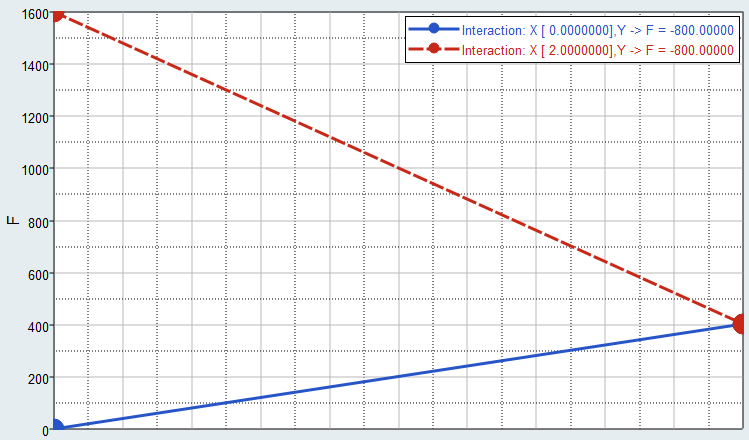
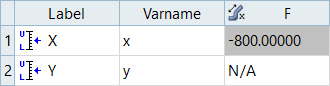
Note:HyperStudy calculates interactions using a regression
based on the data set. In this example, the regression is f(x,y) is
ao+a1*x+a2*y+a3*x*y; where a3 is equal to -400.0 and x and y are between -1.0 and
1.0. The interaction of the input variables x and y on the output response f(x,y) is
-800.0.
 (Interactions Plot) and
  (Interactions Table).
 (single plot) and
 (multiple
plots).
(multiple
plots).