Iterations Post Processing
Visualize Optimization scatter history.
Visualize Optimization Scatter History
Visualize the scatter history of an Optimization in the Iterations post processing tab.
- From the Post Processing step, click the Iterations tab.
-
Using the Channel selector, select the data to plot.
-
Under X Axis and Y Axis, select the channels to plot.
Any two channels can be selected for plotting on the x and y-axis.Tip: For the Y Axis, multiple channels can be selected. Display selected data in a single plot or separate plots by switching the Multiplot option between
 (single plot) and
 (multiple
plots).
(multiple
plots).
-
Under X Axis and Y Axis, select the channels to plot.
- Analyze the plot.
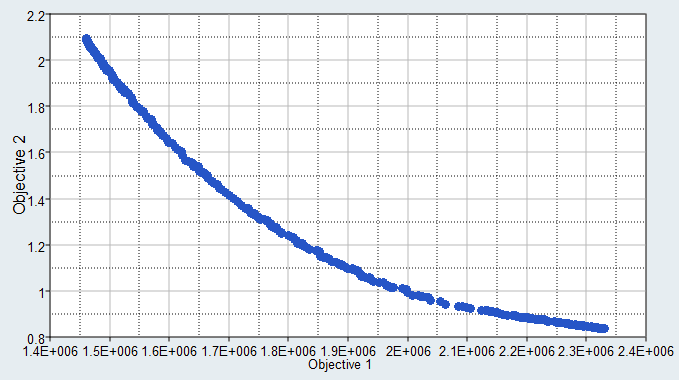
Figure 1.