Show CFD Results
View the results of a CFD simulation in the Analysis Explorer.
Analysis Explorer Options
The Analysis Explorer includes the following options.
Run
To delete a run from the Analysis Explorer, right-click the run name to select Delete Run.
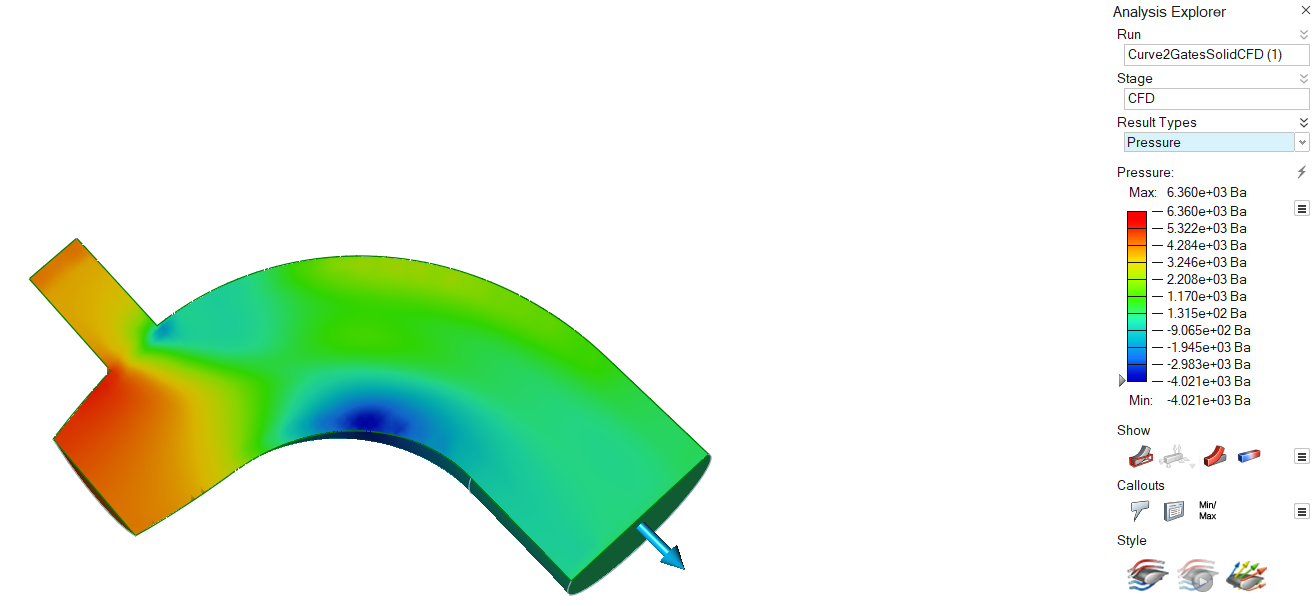
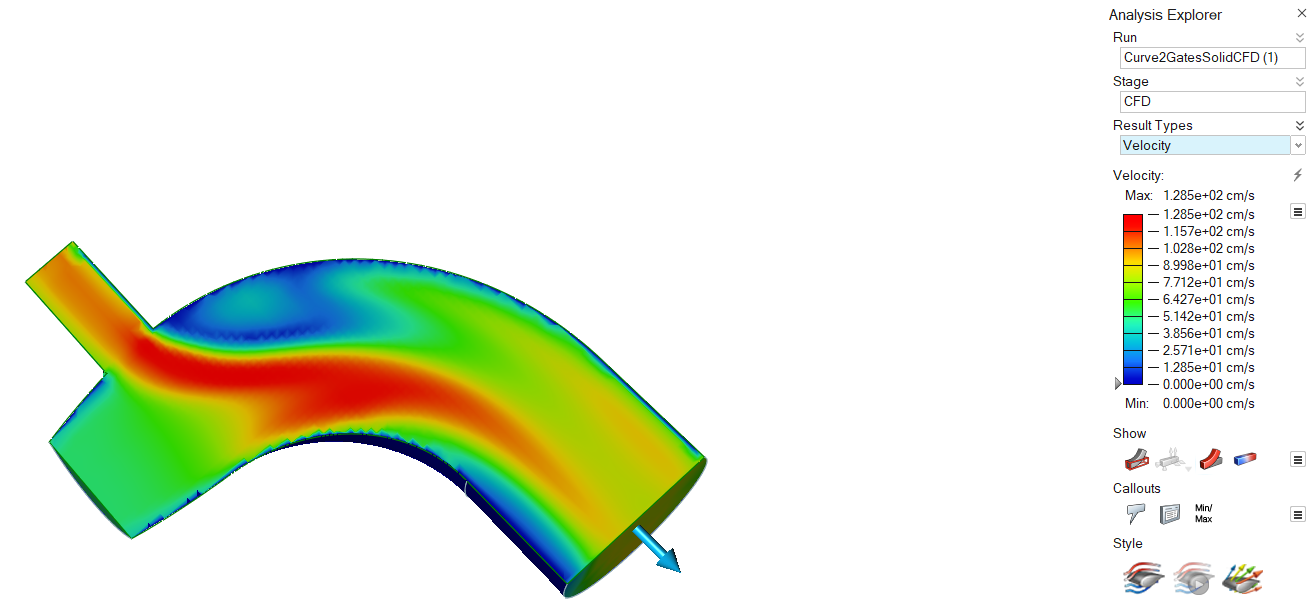
Result Types
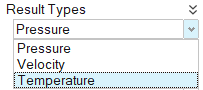
Pressure
Velocity
Temperature
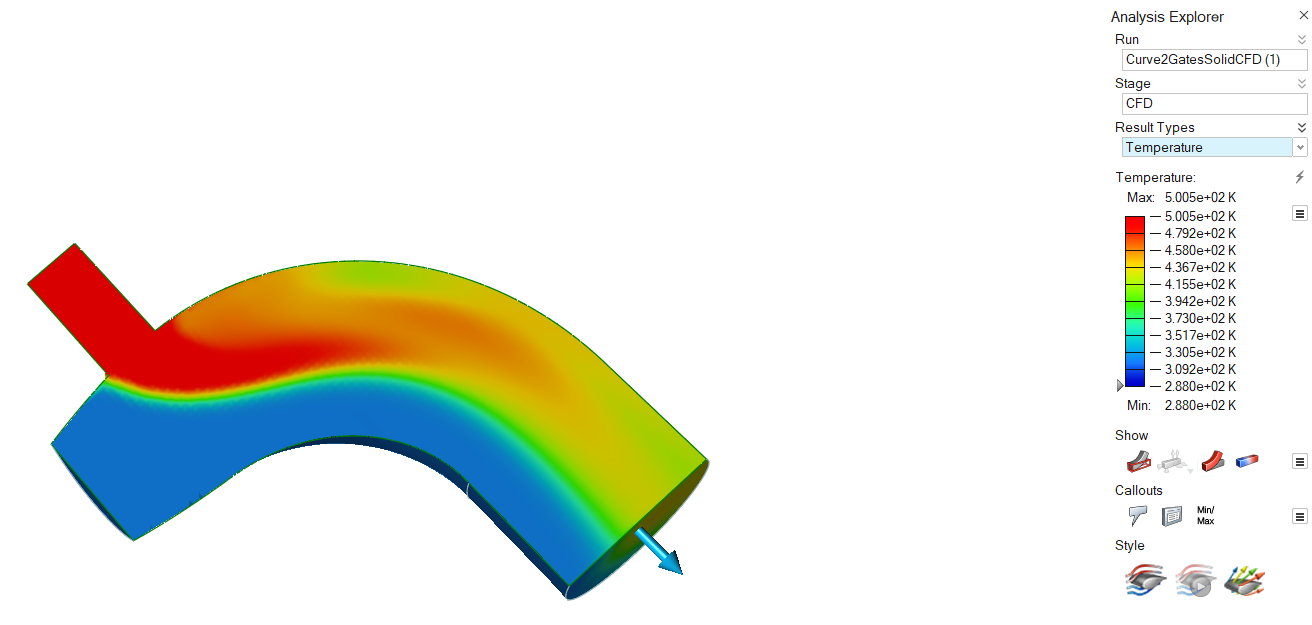
Results Slider
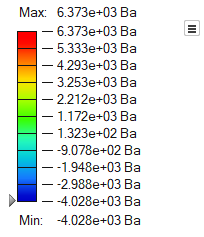
- To change the upper or lower bound for the results slider, click on the bound and enter a new value. Click the reset button to restore the default values.
- To filter the results so that areas on the model with results greater than a
specified value are masked, click and drag the arrow on the results slider.
To mask areas with results less than the specified value, click
 and select Flip
Mask. Select the arrow to enter a specific value.
and select Flip
Mask. Select the arrow to enter a specific value. - To change the legend color for the result type, click the icon next to the results slider and
select Legend Colors.
Show/Hide Elements
When the Analysis Explorer is active, an additional Show/Hide
Elements
![]()
![]() icon appears under the view controls in the lower left
corner of the modeling window.
icon appears under the view controls in the lower left
corner of the modeling window.
Show Options
Determine what is made visible in the modeling window when viewing analysis results. You can show or hide the initial shape, loads and supports, deformation, and/or contours.
| Option | Description | Note | |
|---|---|---|---|
| Show/Hide Initial Shape | Show/hide the initial shape as a reference. | ||
| Show/Hide All Loads and Supports | Show/hide loads and supports. You can also show only the current loads and supports. | ||
| Show/Hide Deformed State | Show/hide the deformed shape as a reference. | ||
| Show/Hide Contours | Show/hide contours. | ||
| Options |
|
||
| Show/Hide Elements | Show/hide the element edges. | This icon appears under the view controls in the lower left of the modeling window, but only when the Analysis Explorer is active. | |
Callout Options
Add visual callouts to show points of interest on your analysis results.
| Option | Description | Note |
|---|---|---|
| Create, Show, and Hide Callouts |
Select to create callouts; select to show and hide callouts. |
|
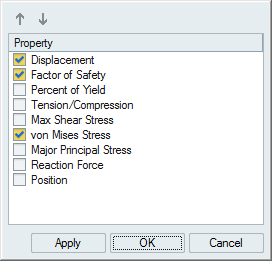
| List Callouts |
Display in a table all of the callouts that have been created, with
the result types and values. Each callout is specific to the selected
run and load case.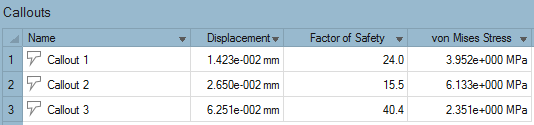 |
|
| Min/Max Callouts |
Create a callout showing where the minimum/maximum value occurs for
the selected result type. Note: When factor of safety is selected, the
minimum value is shown.
|
|
| Plot | Display time history plots for callouts defined for structural analysis. Changes made to the Result Types option are synchronized with the setting on the Analysis Explorer. Using this option allows you to put multiple plots of mixed types on a single page. | This option is only available for motion part analysis results. |
| Dynamic Callouts |
Display the results of various result types in existing callouts.
Note: If you enable the Compare Results feature in a callout, the
callout becomes static.
|
After creating a callout for a particular result type, click the
|
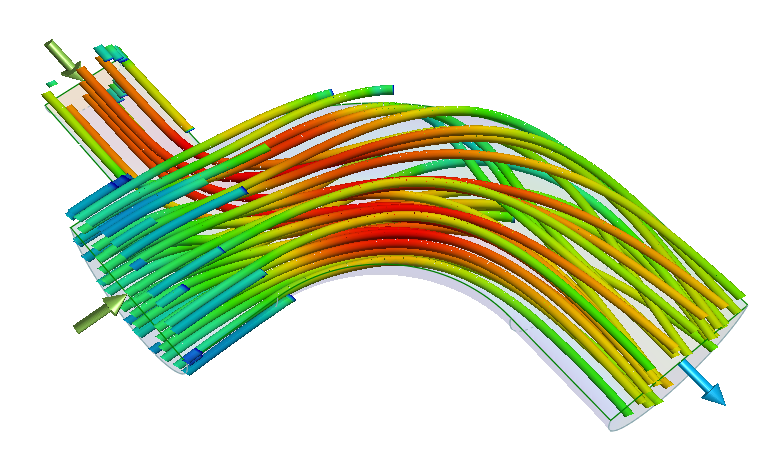
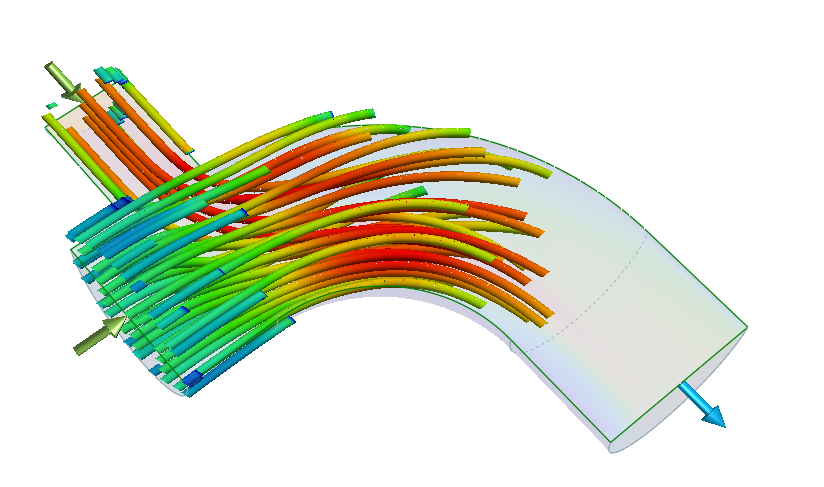
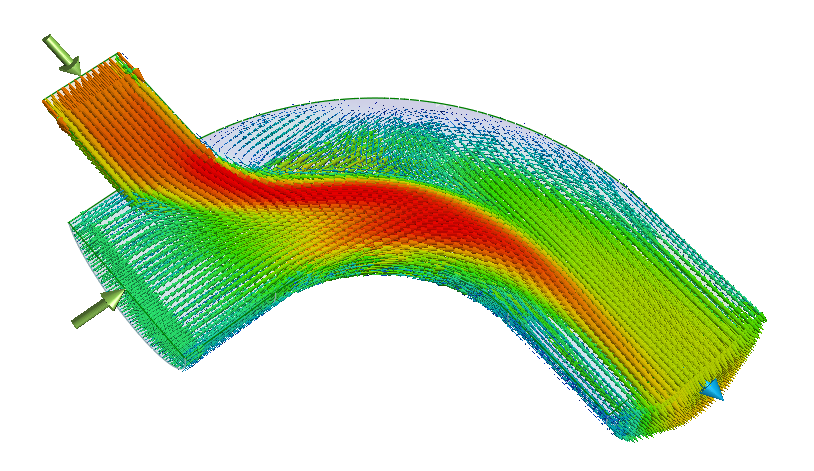
Style Options
Visualize the results as static streamlines, animated streamlines, or vectors.
| Option | Description |
|---|---|
| Static Streamlines |
Visualize the results as static streamlines. In the microdialog, you
can adjust the following parameters:
 |
| Animated Streamlines |
Only available if Streamlines is turned
on. Click the icon once to visualize the results as animated
streamlines. Click the icon again to jump to the end of the
animation.
 |
| Vectors |
Visualize the results as vectors. In the microdialog, you can adjust
the following parameters:
 |