


|
Time Axis Variable Configuration
All of the time series visualizations have the Time Axis variable. There is no need to drag and drop columns to this variable.
Steps:
1. Click on the Time Axis variable drop area of a time series visualization. The Time Axis Settings pane displays.
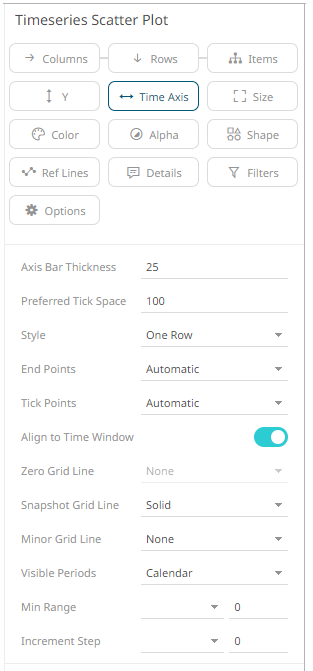
Visualizations supporting time axes include the following settings:
|
Setting |
Description |
|
Axis Bar Thickness |
The margin in pixels for the time axis. The time axis is hidden if this is set to zero. Default is 25. |
|
Preferred Tick Space |
The preferred space in pixels between minor grid lines across the axis. Default is 100. |
|
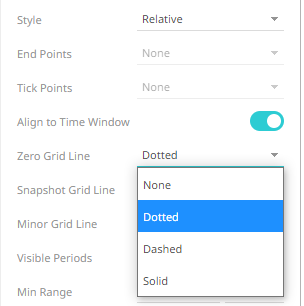
Style |
Defines that the time-based axis is displayed across two rows, with the start and end points displayed on the bottom row. When Relative is selected, the time forwards and backwards from a set time (i.e., midnight will be shown as 00:00 on the axis) will be displayed. The prior hours/days from midnight at the start of day are negative and the future hours/days are positive. For example: · Last midnight is 00:00 · Noon yesterday is -12:00 (-12 hours) · Noon today is 12:00 (+12 hours) The axis values can have the following tick mark labels: -12.00, -6.00, 0:00, 6.00, 12:00 |
|
End Points |
Determines whether to display end points. Allowed values: · Automatic – automatically displays the end points. · None – end points are not displayed. · Custom – allows the selection of the Date/Time format of end points. |
|
Tick Points |
Determines whether to display tick points. Allowed values: · Automatic – automatically displays the tick points. · None – tick points are not displayed. · Custom – allows the selection of the Date/Time format of tick points. |
|
Align to Time Window |
Align with the time window set in the Time Filter Box. Enabled by default when creating a new time series visualization. |
|
Zero Grid Line |
For the Relative Style, set how a major X axis grid line is drawn:
|
|
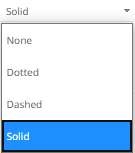
Snapshot Grid Line |
Determines whether a grid line is drawn showing the snapshot location. Allowed values: · None · Dotted · Dashed · Solid When the Snapshot Grid Line is rendered, the Set Snapshot Here option will be available in the visualization context menu in the web client. |
|
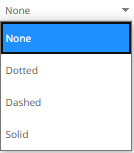
Minor Grid Line |
Determines whether minor grid lines are drawn across the axis. Allowed values: · None · Dotted · Dashed · Solid |
|
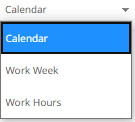
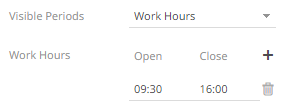
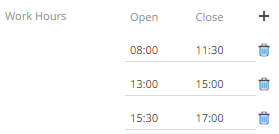
Visible Periods |
Determines whether: · a standard calendar time axis is shown (Calendar). · weekends are hidden (Work Week). · weekends and closed market hours are hidden (Work Hours). The settings pane changes to allow the addition and setting of the work hours.
o Open – Defines what time the market opens. o Close – Defines what time the market closes. Click
Click
|
|
Min Range |
The minimum time axis range. Supported units are milliseconds, seconds, minutes, hours, days, months, quarters, and years. |
|
Increment Step |
Controls how much the time axis span is extended at the point when the latest value is at the end of the current time axis span. Supported units are milliseconds, seconds, minutes, hours, days, months, quarters, and years. This setting helps in seeing how a real-time data set grows from left to right along the time axis, giving a better impression and understanding of the progress. |


2. Click the Save  icon on the toolbar.
When saved, the  notification
is displayed.
notification
is displayed.