Creating a Custom Sort Order
For this sample data:
|
Month |
Weekday |
Date |
MonthNo |
WeekdayNo |
|
January |
Monday |
01/01/2021 |
1.00 |
1.00 |
|
February |
Tuesday |
|
2.00 |
2.00 |
|
March |
Wednesday |
|
3. 00 |
3.00 |
|
April |
Thursday |
|
4. 00 |
4.00 |
|
May |
Friday |
|
5. 00 |
5.00 |
|
June |
Saturday |
|
6. 00 |
6.00 |
|
July |
Sunday |
|
7. 00 |
7.00 |
|
August |
Monday |
|
8. 00 |
1.00 |
|
September |
Tuesday |
|
9. 00 |
2.00 |
|
October |
Wednesday |
|
10. 00 |
3.00 |
|
November |
Thursday |
|
11. 00 |
4.00 |
|
December |
Friday |
|
12. 00 |
5.00 |
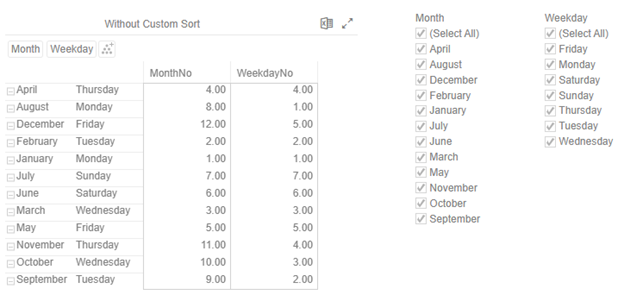
When used in a visualization or filters, will be displayed as:

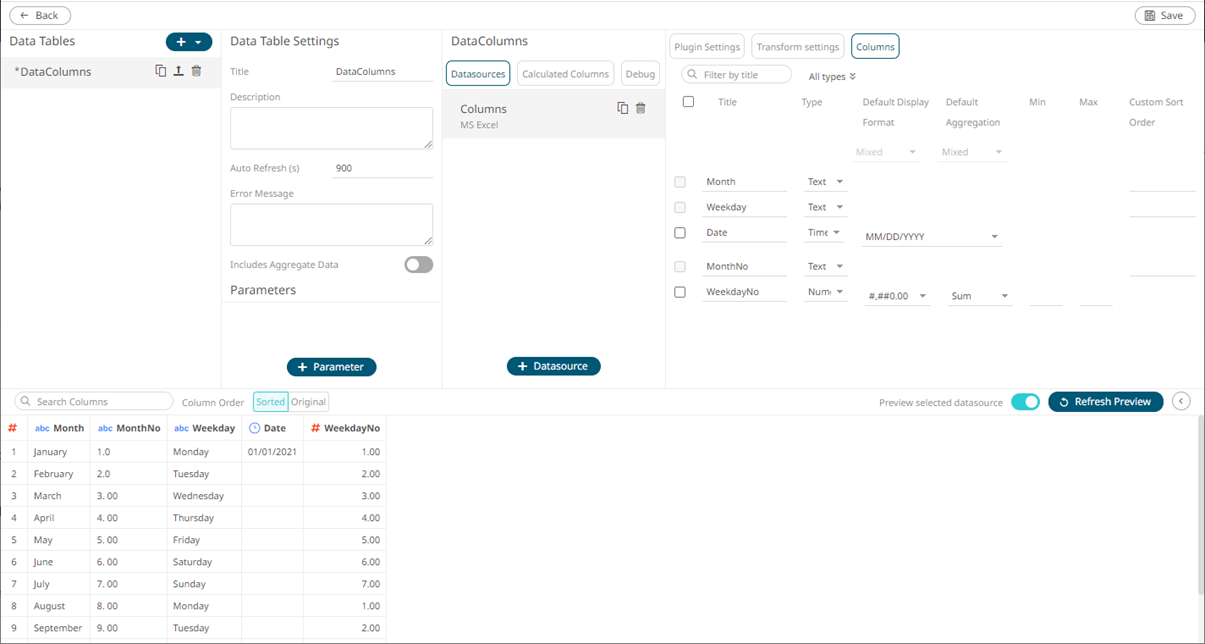
On the Columns pane in the Edit Data Table layout, you can create the custom sort order of the dimensions or text columns of the selected data source. Consequently, this allows the dimensions to be displayed in a visualization and filter in the correct or desired order.
Steps:
1. Click the Columns button.
The Columns pane is displayed.

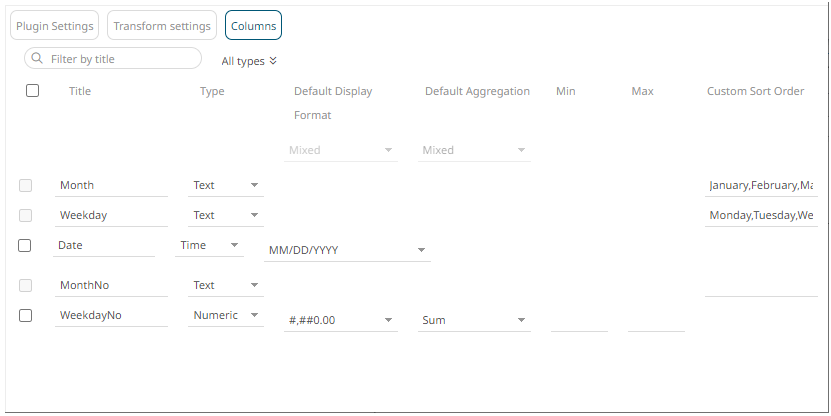
2. Enter the order of the values (separated by a comma) of the dimensions or text columns under the Custom Sort Order section.
|
Title |
Custom Sort Order |
|
Month |
January,February,March,April,May |
|
Weekday |
Monday,Tuesday,Wednesday,Thursday,Friday,Saturday,Sunday |

3. Click  . Once saved,
a notification displays.

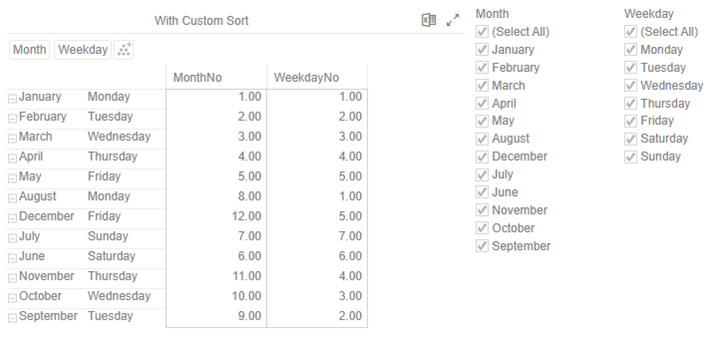
Using the data with custom sort order, the visualization and filters will now be displayed as:


