|
Adding Visualizations to the Dashboards
After double-clicking or drawing a rectangle on the dashboard canvas, click on a visualization that you want to add from the Select Part pane.
The properties and components of the selected visualization are displayed. For example, here are the properties for the Table visualization:
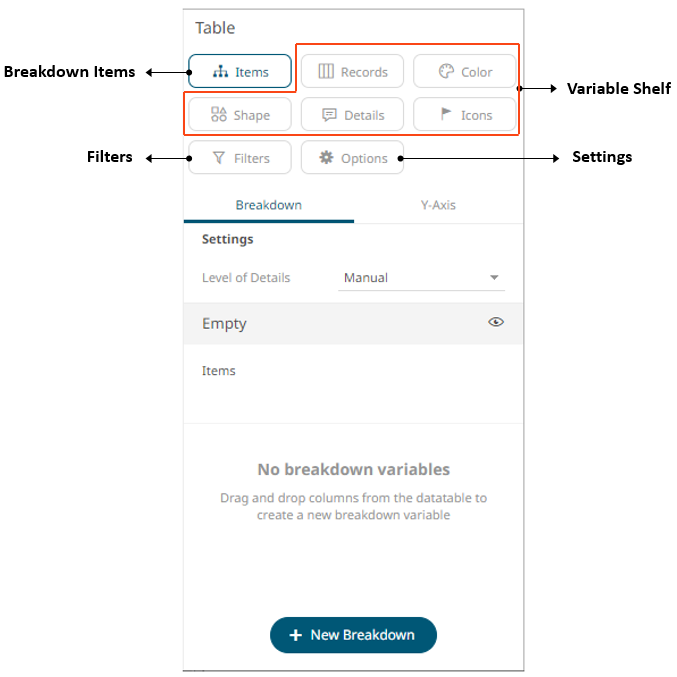
Each visualization consists of five components:
q Filters
q Visualization Display Area
|
NOTE |
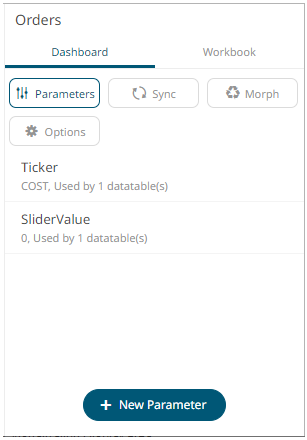
Adding a visualization on the dashboard displays the available parameters of the associated data table on the Dashboard tab. This means the associated data table expects these parameter values to exist on the dashboard. For example:
|