


|
Setting the Server Metrics Publisher
The server performance metrics can be used to report, monitor, and configure the server’s health and limits. The collected metrics may include the following information:
q Long polling, WebSocket, and total number of connections
q CPU loading percentage
q Maximum, size, and used Heap Bytes
q Subscription alerts, users, and total
q Number of parallel data loading and live threads
q Average data load time or refresh rate
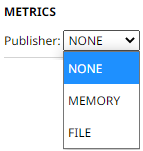
On the Metrics section of the System Settings page, select the Publisher of the server performance metrics.
|
Metrics Publisher |
Description |
|
None |
No metrics are published. |
|
Memory |
Metrics are published to a queue in memory. |
|
File |
Metrics are published to a file on disk located in the AppData/Metrics/ folder (i.e., c:\vizserverdata\Metrics). |
To add other Kafka publishers in the drop-down list, ensure their configuration file are available in the AppData/Metrics/Config folder.
A configuration file can be generated by creating a new data source in the Panopticon Streams Server and selecting any of the Output connectors. You can either:
q export the JSON file from the repository, or
q download the DSM file by right-clicking the Data Source and clicking Download on the context menu
Refer to the Panopticon Streams Server Installation and Reference Guide for more information.
For example, when the generated Kafla data sources are added in the AppData/Metrics/Config folder:
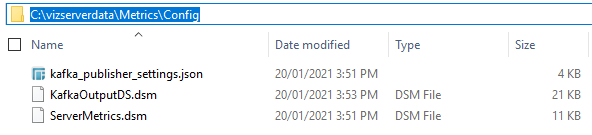
The ID of the new configuration files are displayed in the Publisher drop-down list.
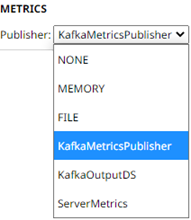
Selecting any of these specific Kafka data sources means that this is only place where metrics will be published to.