


|
Numeric Line Graph
Numeric Line Graphs differ from the standard line graph in that they have a numeric X axis, rather than one based upon time.
They are commonly used in both scientific and financial scenarios to show trends in functions that are based on two numeric inputs (X and Y).
Common uses include the display of Yield Curves.
Numeric Line Graphs can also be used to display selected cuts through a Surface Plot.
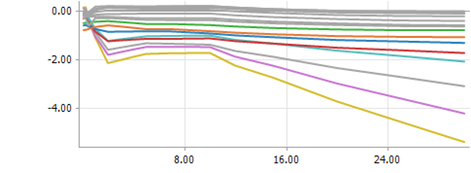
Figure 3-36. A numeric line graph.
Numeric Line Graphs can also be displayed on their side through a Vertical Numeric line Graph. These graphs are typically used in the Oil Industry for displaying drill sensor data.
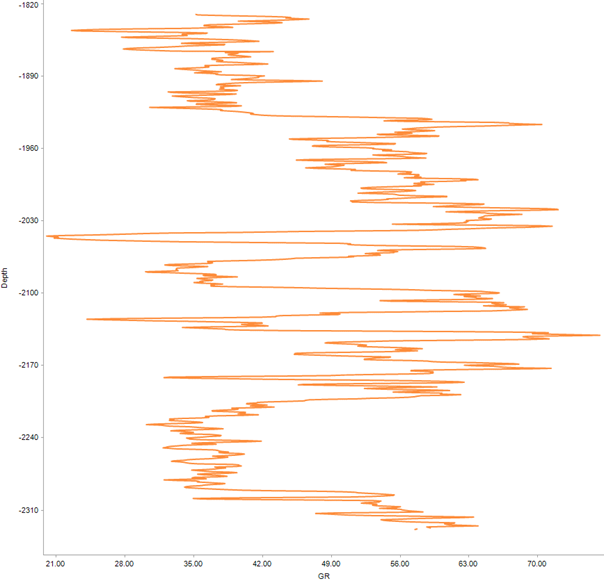
Figure 3-37. A Vertical numeric line graph.
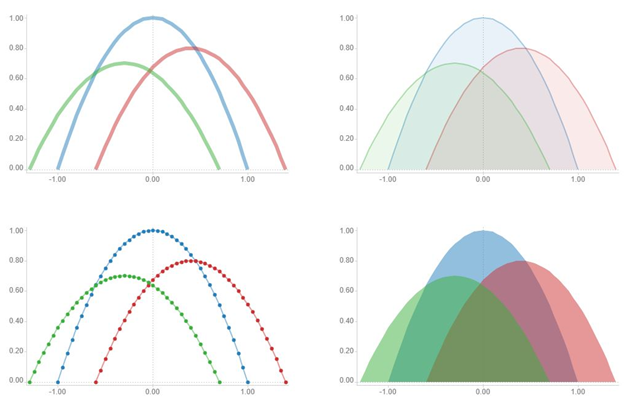
Figure 3-38. Several numeric line graphs.