


|
Needle Graph
Needle Graphs display time-based transactions or occurrence frequencies, rather than time-based trends. They are simply time-based Bar Graphs where each bar is located at a particular time point on the axis.
They work especially well when combined with a Line Graph.
The most common use of a Needle Graph is when showing the trading volume for a stock, typically underneath the price performance.
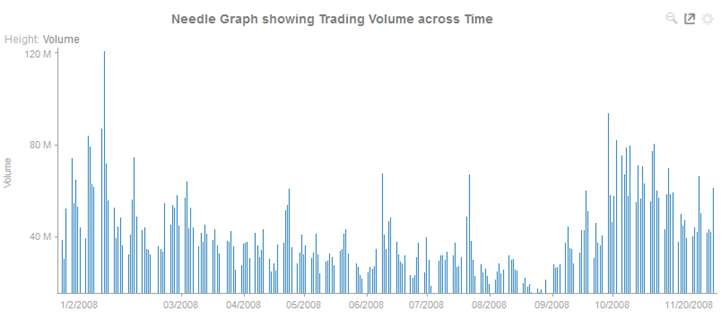
Figure 2-15. A needle graph
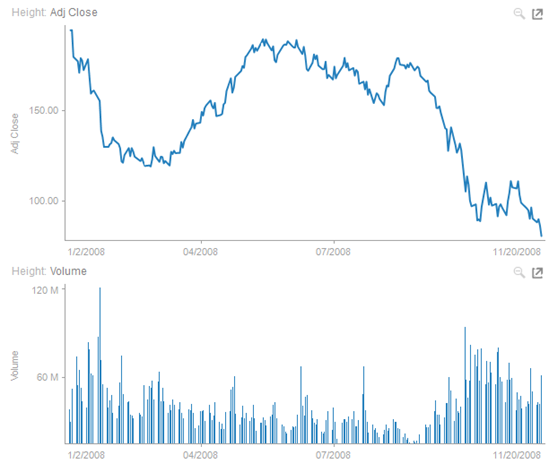
Figure 2-16. A needle graph in combination with a line graph.
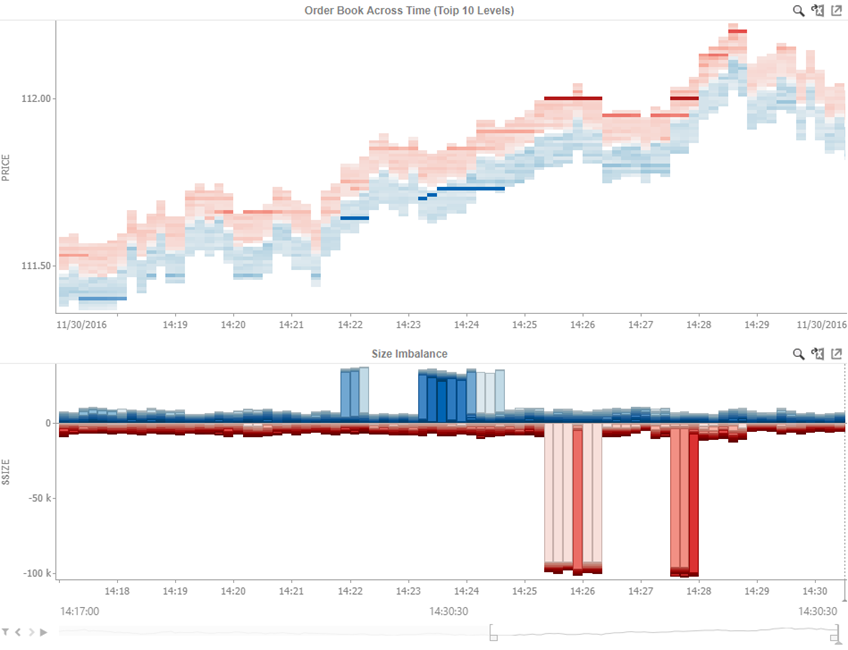
Figure 2-17. A needle graph with full width needles in combination with an Order Book graph.