Add Callouts to the Results
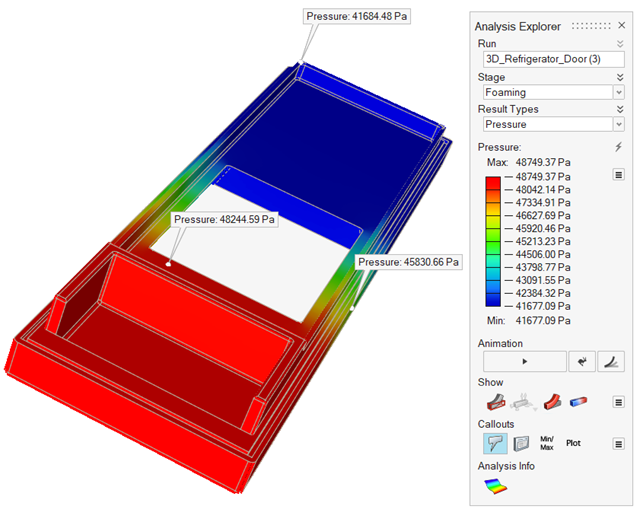
Call out and review values for a selected result type at points of interest on your model using the callout icons in the Analysis Explorer.
-
To create a callout at a point of interest, click
 in the Analysis Explorer, select a
Result Type, and then click a point on your model.
Box-select to see the maximum value in an area.
Note: The callout value applies to the currently selected run.
in the Analysis Explorer, select a
Result Type, and then click a point on your model.
Box-select to see the maximum value in an area.
Note: The callout value applies to the currently selected run. -
To automatically create callouts showing where the minimum and maximum values
occur for a result type, select a Result Type, and then
click
 .
.
- Optional:
To display callouts in a table, click
 in the Analysis Explorer.
Each callout is specific to a selected run.
in the Analysis Explorer.
Each callout is specific to a selected run.
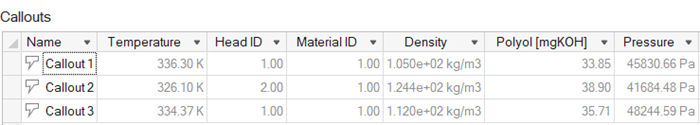
- Selecting a row in the table also selects the callout in the modeling window.
- To show or hide a single callout, in the Callouts table, Name column,
click
 .
. - To show or hide all callouts, in the Analysis Explorer, click .
- To sort the order of a column in the table, click the column header. Or
you can click
 or
or  to select Sort
Ascending or Sort Descending.
to select Sort
Ascending or Sort Descending.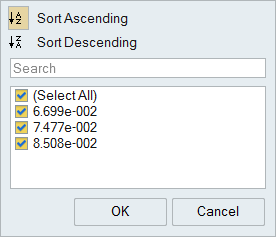
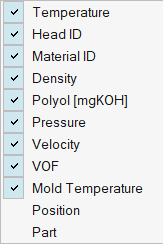
- To add or delete columns on the table, right-click a column header, and
then select or deselect a property.
-
To display specimens in a table, click
 in the Analysis Explorer.