Specifying the Major Axes Range
Specify the range for the major axes.
Select the graph where you want to change the axis
range.
-
On the Cartesian
context tab, on the Display tab, on the Axes group, click the
 Axis settings icon.

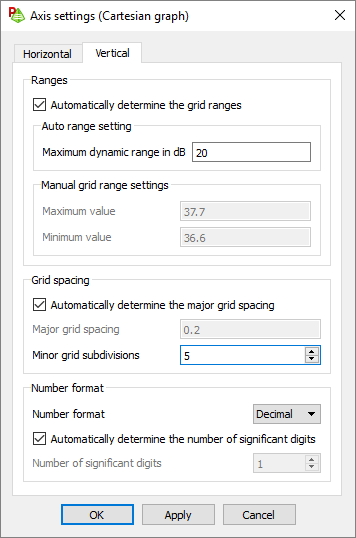
Figure 1. The Axis settings dialog. -
On the Surface
contextual tabs set, on the Display tab, in the
Axes group, click the
 Axis settings icon.

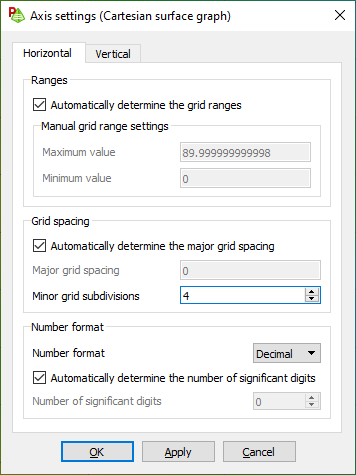
Figure 2. The Axis settings dialog. -
Select the axis that you want to modify.
- To modify the grid range for the horizontal axis, click Horizontal.
- To modify the grid range for the vertical axis, click Vertical.
-
Under Ranges, select one of the following:
- To automatically determine the grid range, select the
Automatically determine the grid range check
box.
- To specify the dynamic range for the vertical axis,
under Auto range setting, in the
Maximum dynamic range in dB field, enter
a value for the dynamic range in dB.Note: For the Maximum value the maximum value of the traces is used. For the Minimum value the minimum value of the traces is used, or the maximum value of the traces minus the specified dynamic range, whichever is larger.
- To specify the dynamic range for the vertical axis,
under Auto range setting, in the
Maximum dynamic range in dB field, enter
a value for the dynamic range in dB.
- To specify the grid range, clear the Automatically determine
the grid range check box.
- In the Maximum value field, enter a value for the upper limit of the graph.
- In the Minimum value field, enter a value for the lower limit of the graph.
- To automatically determine the grid range, select the
Automatically determine the grid range check
box.
- Click OK to apply the settings and to close the dialog.