A Cartesian graph is the classical line
graph and most simple graph type. This graph type is used when you want to view closely
related series of data. Any data can be viewed on a Cartesian graph.
On the Home tab, in the
Create new display group, click the Cartesian icon.
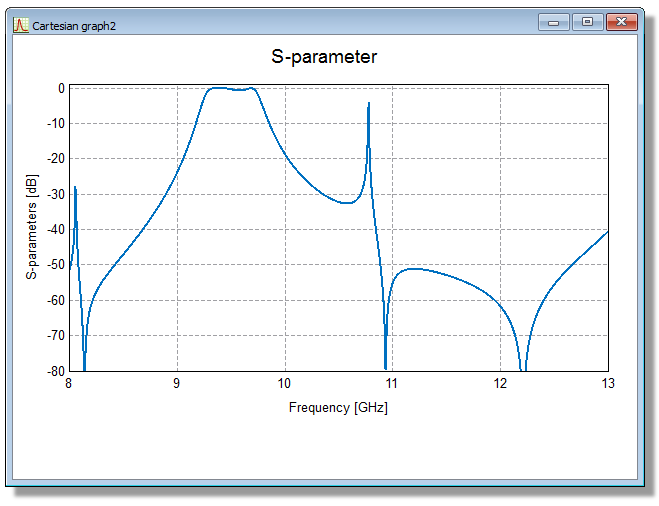
Figure 1. Example of a Cartesian
graph with S-parameter results.
 Cartesian icon.